ELK Stack — Elasticsearch, Logstash & Kibana Log Management
Scattered logs across dozens of services make troubleshooting a needle-in-a-haystack exercise. Opsio deploys the ELK Stack — Elasticsearch for search, Logstash for ingestion, Kibana for visualization — to give your teams instant access to every log line across your entire infrastructure, with powerful full-text search and real-time analytics.
Trusted by 100+ organisations across 6 countries
TB+
Log Volume
< 1s
Search Speed
Any
Log Source
Real-time
Analytics
What's Included
Elasticsearch Cluster Design
Right-sized clusters with hot-warm-cold architecture, ILM policies, and cross-cluster search for cost-effective long-term retention. We design shard strategies based on your index size and query patterns, configure node roles (master, data-hot, data-warm, data-cold, coordinating) for optimal resource utilization, and implement snapshot lifecycle policies for archival to S3, GCS, or Azure Blob. Cluster sizing is based on your specific ingestion rate, retention requirements, and concurrent query load.
Log Pipeline Engineering
Logstash and Filebeat pipelines that parse, enrich, and route logs from applications, containers, cloud services, and network devices. We build grok patterns for custom log formats, configure multiline parsing for stack traces and Java exceptions, add GeoIP enrichment for access logs, and implement conditional routing that sends security events to a dedicated index while application logs go to another. Ingest node pipelines handle simple transformations without the overhead of Logstash.
Kibana Dashboards & Visualization
Custom dashboards for application debugging, security analytics, compliance reporting, and business event tracking. We build Kibana Lens visualizations, saved searches with pre-configured filters, and Kibana Spaces that isolate dashboards by team or function. Canvas workpads provide presentation-ready operational displays, and Kibana alerting rules trigger notifications based on log patterns, aggregations, or anomaly detection.
Elastic Security (SIEM)
Detection rules, threat intelligence integration, and security analytics using Elastic Security for cloud-native SIEM capabilities. We configure over 500 pre-built detection rules aligned to MITRE ATT&CK framework, enable machine learning anomaly detection jobs for user behavior analytics (UEBA), integrate threat intelligence feeds (STIX/TAXII, AbuseCH, AlienVault OTX), and set up case management workflows for security incident investigation and response.
Kubernetes Log Management
Filebeat DaemonSet deployment for automatic container log collection with Kubernetes metadata enrichment (pod name, namespace, labels, annotations). We configure autodiscover with hints-based parsing so different application log formats are handled automatically, implement log rotation and back-pressure handling to prevent node disk exhaustion, and build namespace-scoped Kibana dashboards for development team self-service log access.
Performance Optimization & Tuning
Elasticsearch performance tuning for search-heavy and ingest-heavy workloads. We optimize index mappings to reduce storage (keyword vs. text fields, disabling norms and doc_values where unnecessary), configure search-tier caching, tune JVM heap settings, and implement index sorting for common query patterns. For high-ingest environments, we configure bulk indexing parameters, thread pool sizing, and refresh intervals to maximize throughput without dropping data.
Our AWS migration has been a journey that started many years ago, resulting in the consolidation of all our products and services in the cloud. Opsio, our AWS Migration Partner, has been instrumental in helping us assess, mobilize, and migrate to the platform, and we're incredibly grateful for their support at every step.

Roxana Diaconescu
CTO · SilverRail Technologies
Two enterprise security platforms. Included free.
Others pay a fortune for continuous vulnerability monitoring and a unified security-and-cost workspace — and then pay again for the people to run them. Every Opsio managed-cloud customer gets both, at no extra cost, with our engineers acting on what they surface.
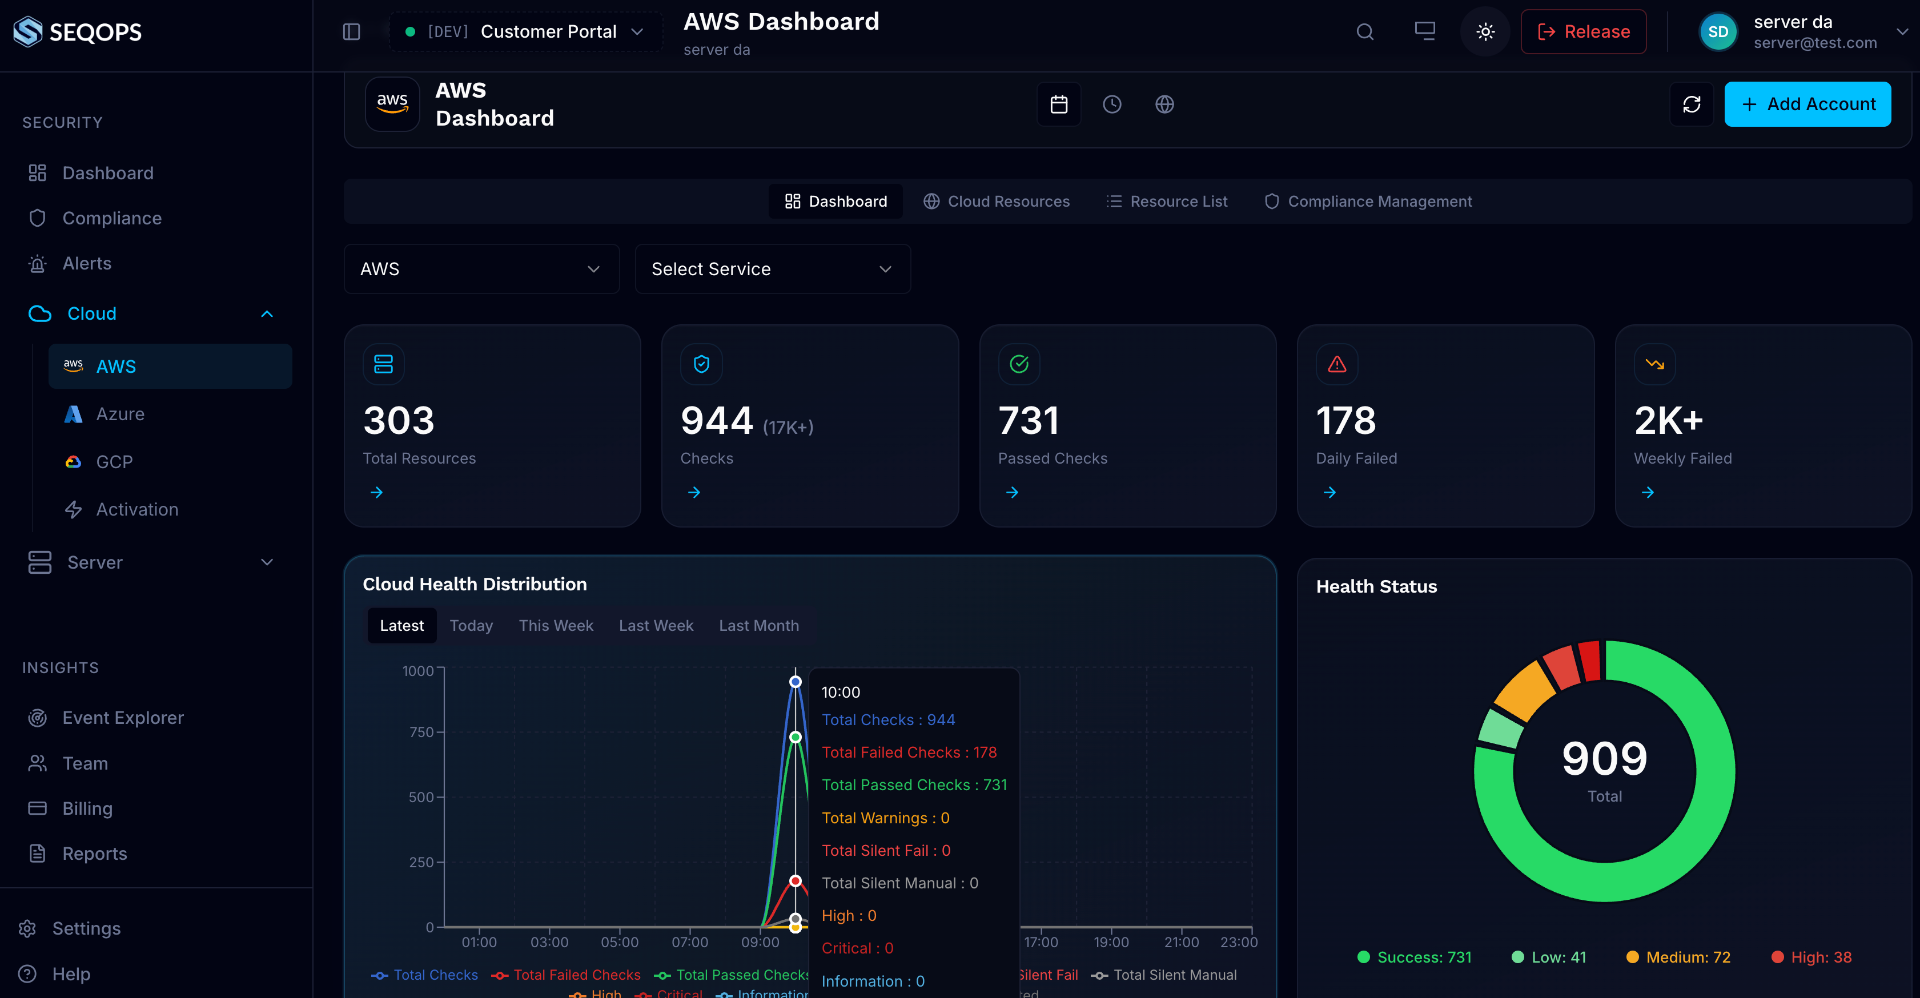
SeqOps
Continuous vulnerability monitoring across your entire cloud & server estate — always on, never in the way.
- Every vulnerability, misconfiguration & exposure found continuously across AWS, Azure, GCP, Windows & Linux
- AI ranks findings by real risk, so effort goes where it matters
- Continuous compliance scoring: NIS2 · ISO 27001 · GDPR · PCI · HIPAA
- Read-only — collects security metadata, never your data
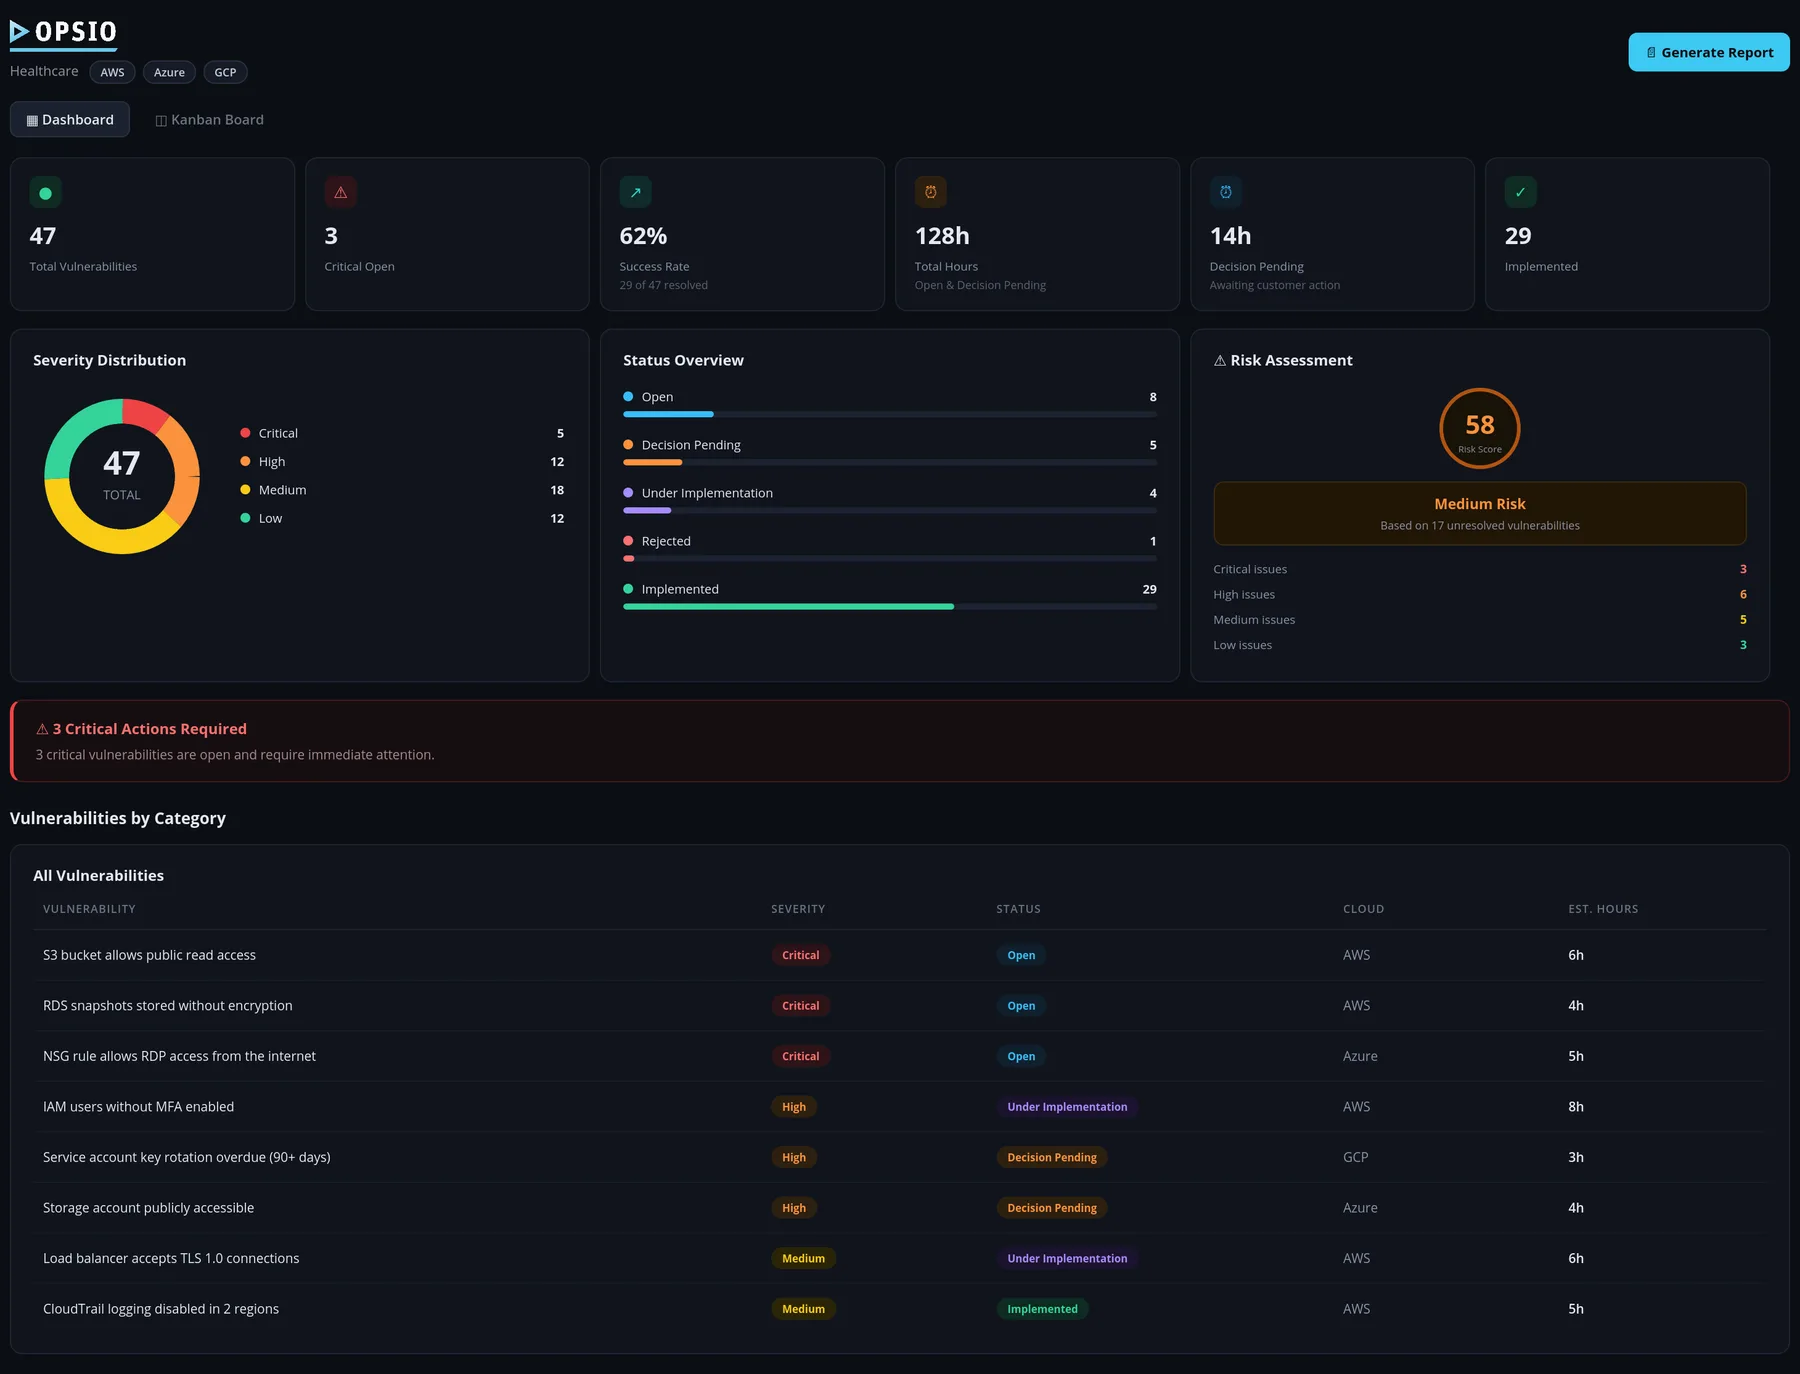
Opsio Shield
One intelligent workspace that unifies security posture, compliance scoring and cloud cost — so nothing hides between tools.
- Security posture, compliance score & multi-cloud spend on one live dashboard
- Cost anomalies & budget overruns caught before the invoice lands
- Auto-generated compliance evidence & vulnerability reports
- Encrypted secrets, mandatory MFA & row-level isolation by design
It's simply part of being an Opsio managed-cloud customer.
Centralize Your Logs Search Everything Instantly
When production breaks at 3 AM, your team should not be SSH-ing into 40 servers to grep log files. Disconnected logging creates blind spots during incidents, makes compliance audits painful, and hides security threats that span multiple systems. Organizations without centralized log management report incident resolution times that are 4-6x longer because engineers spend most of their time finding the relevant logs rather than analyzing them. In regulated industries, scattered logs mean compliance audits require weeks of manual evidence collection. Opsio implements the ELK Stack to centralize every log — application, infrastructure, security, audit — into a single searchable platform. Our deployments include optimized Logstash pipelines that parse, enrich, and route logs efficiently, Elasticsearch clusters sized for your retention and query patterns, and Kibana dashboards that turn raw logs into operational intelligence. Every deployment is designed for your specific log volume, retention requirements, and query patterns — not a one-size-fits-all template.
The ELK Stack works by collecting logs from every source through lightweight Filebeat agents (or Logstash for complex transformations), processing them through ingest pipelines that parse unstructured text into structured fields, and indexing them in Elasticsearch for sub-second full-text search. Elasticsearch's inverted index architecture enables searching across terabytes of log data in milliseconds — finding a specific error message across 500 million log entries takes less than a second. Kibana provides the visualization layer with dashboards, saved searches, and Lens for drag-and-drop data exploration. For Kubernetes environments, we deploy Filebeat as a DaemonSet that automatically collects container stdout/stderr and enriches logs with pod, namespace, and deployment metadata.
The business impact is immediate and measurable. Clients moving from server-level log files to Opsio-managed ELK typically see incident MTTR drop by 60-75% because engineers can search across all services instantly instead of hunting through individual servers. Security teams gain visibility into threats that were previously invisible — failed login attempts across multiple services, unusual API access patterns, and data exfiltration indicators that span system boundaries. Compliance teams can generate audit reports in minutes rather than weeks. One healthcare client reduced their HIPAA audit preparation from 3 weeks of manual log collection to a 15-minute Kibana search.
ELK is the ideal choice for organizations with high log volumes (1+ TB/day) where per-GB SaaS pricing would be prohibitively expensive, environments that require full data sovereignty with logs remaining within their own infrastructure, use cases that need both operational log analytics and security SIEM capabilities in a single platform, and teams that require full-text search across unstructured log data (not just structured metrics). ELK's Elastic Security module provides a SIEM with over 1,000 pre-built detection rules, threat intelligence integration, and case management — making it a dual-purpose platform for both operations and security.
However, ELK is not the right tool for every scenario. Elasticsearch clusters require significant operational expertise — node sizing, shard management, index lifecycle policies, JVM tuning, and cluster health monitoring. Organizations without dedicated infrastructure engineering should consider Elastic Cloud (managed Elasticsearch) or Datadog Logs as lower-operational-overhead alternatives. For simple log search without analytics, a lightweight solution like Grafana Loki (which indexes labels only, not full text) is more efficient and cheaper to operate. ELK is not a metrics monitoring platform — do not try to replace Prometheus with Elasticsearch for time-series metrics. Opsio helps you evaluate whether self-managed ELK, Elastic Cloud, Datadog Logs, or Loki is the right fit for your requirements and team capabilities. Related Opsio services: Datadog Monitoring — Full-Stack Observability for Cloud Infrastructure, and Prometheus & Grafana — Open-Source Observability Stack.
How Opsio Compares
| Capability | ELK Stack | Splunk | Datadog Logs | Grafana Loki |
|---|---|---|---|---|
| Search type | Full-text + structured | Full-text + structured (SPL) | Full-text + structured | Label-based only (LogQL) |
| Licensing cost | Free (open source) | $$ (per-GB/day) | $$ (per-GB ingested) | Free (open source) |
| Cost at 2 TB/day (annual) | $40-80K (infra + ops) | $300-600K | $150-250K | $20-40K (infra + ops) |
| SIEM capability | Built-in (Elastic Security) | Splunk Enterprise Security (extra cost) | Cloud SIEM (extra cost) | No built-in SIEM |
| Query language | KQL + Lucene | SPL (powerful) | Log query syntax | LogQL |
| Operational overhead | High (self-managed) | Low (Splunk Cloud) / High (on-prem) | None (SaaS) | Medium (simpler than ELK) |
| APM correlation | Elastic APM (separate) | Splunk APM (separate) | Native trace-to-log correlation | Tempo integration |
| Data sovereignty | Full (self-hosted) | On-prem option available | SaaS only (US/EU) | Full (self-hosted) |
Ready to get started?
What You Get
Pricing & Investment Tiers
Transparent pricing. No hidden fees. Scope-based quotes.
ELK Assessment
$8,000–$15,000
Log source inventory, volume analysis, and cluster architecture design
ELK Implementation
$25,000–$60,000
Cluster deployment, pipeline engineering, dashboards, and Elastic Security
Managed ELK Operations
$4,000–$15,000/mo
24/7 cluster monitoring, ILM management, upgrades, and capacity planning
Transparent pricing. No hidden fees. Scope-based quotes.
Questions about pricing? Let's discuss your specific requirements.
ELK Stack — Elasticsearch, Logstash & Kibana Log Management
Free consultation