Datadog Monitoring — Full-Stack Observability for Cloud Infrastructure
Blind spots in your infrastructure lead to slow incident response, missed SLAs, and customer-impacting outages. Opsio implements Datadog as your single pane of glass — infrastructure metrics, application performance monitoring (APM), log management, and synthetic testing — correlated in real-time across your entire cloud stack.
Trusted by 100+ organisations across 6 countries
750+
Integrations
< 5 min
MTTR Reduction
100%
Stack Coverage
24/7
Monitoring
What's Included
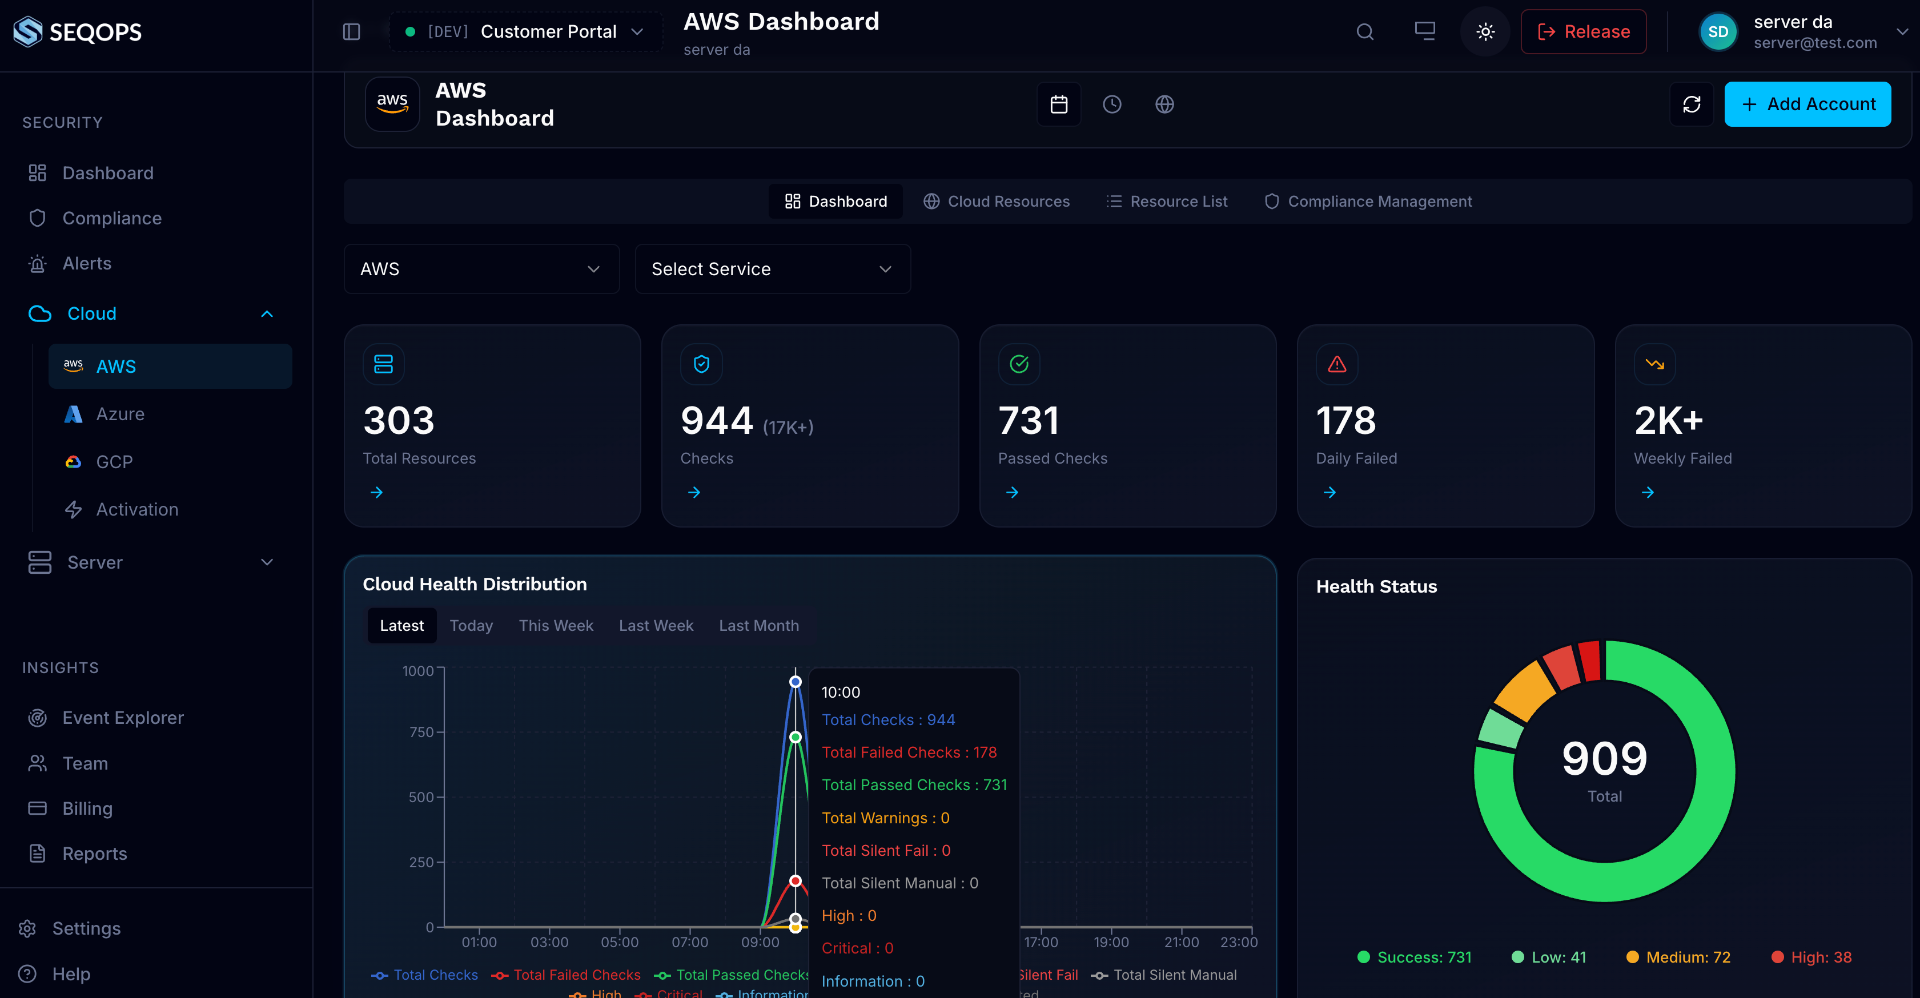
Infrastructure Monitoring
Agent deployment across EC2, AKS, GKE, and on-premises with auto-discovery, tagging strategy, and custom metrics for business KPIs. We configure host maps for topology visualization, implement process-level monitoring for resource utilization analysis, and create infrastructure dashboards that correlate system metrics with application performance for rapid root cause analysis.
Application Performance Monitoring
Distributed tracing across microservices with flame graphs, error tracking, and latency percentile analysis. We instrument Java, Python, Node.js, Go, .NET, and Ruby applications with Datadog APM libraries, configure trace sampling strategies that balance visibility with cost, and build service maps that visualize dependencies and bottlenecks across your entire application topology.
Log Management & Analytics
Centralized log ingestion with pipelines, faceted search, pattern detection, and log-to-trace correlation. We build Datadog log pipelines that parse, enrich, and route logs from every source. Exclusion filters and archive rules control costs while maintaining compliance retention. Log patterns automatically cluster similar log entries to surface anomalies without manual query writing.
Synthetic & Real User Monitoring
API tests, browser tests, and RUM for end-to-end user experience visibility from every geography. We configure synthetic tests that validate API endpoints and critical user journeys every 60 seconds from global locations. RUM tracks real user sessions with Core Web Vitals, error rates, and conversion correlation. Combined with APM backend traces, you see the full picture from browser click to database query.
Intelligent Alerting & Incident Management
Composite monitors that correlate multiple signals before firing, anomaly detection using machine learning baselines, and SLO-based burn rate alerts that notify teams only when service reliability is genuinely threatened. We configure escalation policies with PagerDuty, OpsGenie, or Slack integration, and build automated runbooks that accelerate incident triage with pre-populated dashboards and diagnostic queries.
Cloud Security Monitoring
Datadog Cloud SIEM for security event correlation across cloud infrastructure, application logs, and user activity. We configure detection rules aligned to MITRE ATT&CK framework, cloud security posture management (CSPM) for misconfiguration detection across AWS, Azure, and GCP, and compliance dashboards tracking CIS benchmark adherence in real-time.
Opsio has been a reliable partner in managing our cloud infrastructure. Their expertise in security and managed services gives us the confidence to focus on our core business while knowing our IT environment is in good hands.
Magnus Norman
Head of IT · Löfbergs
Two enterprise security platforms. Included free.
Others pay a fortune for continuous vulnerability monitoring and a unified security-and-cost workspace — and then pay again for the people to run them. Every Opsio managed-cloud customer gets both, at no extra cost, with our engineers acting on what they surface.
SeqOps
Continuous vulnerability monitoring across your entire cloud & server estate — always on, never in the way.
- Every vulnerability, misconfiguration & exposure found continuously across AWS, Azure, GCP, Windows & Linux
- AI ranks findings by real risk, so effort goes where it matters
- Continuous compliance scoring: NIS2 · ISO 27001 · GDPR · PCI · HIPAA
- Read-only — collects security metadata, never your data
Opsio Shield
One intelligent workspace that unifies security posture, compliance scoring and cloud cost — so nothing hides between tools.
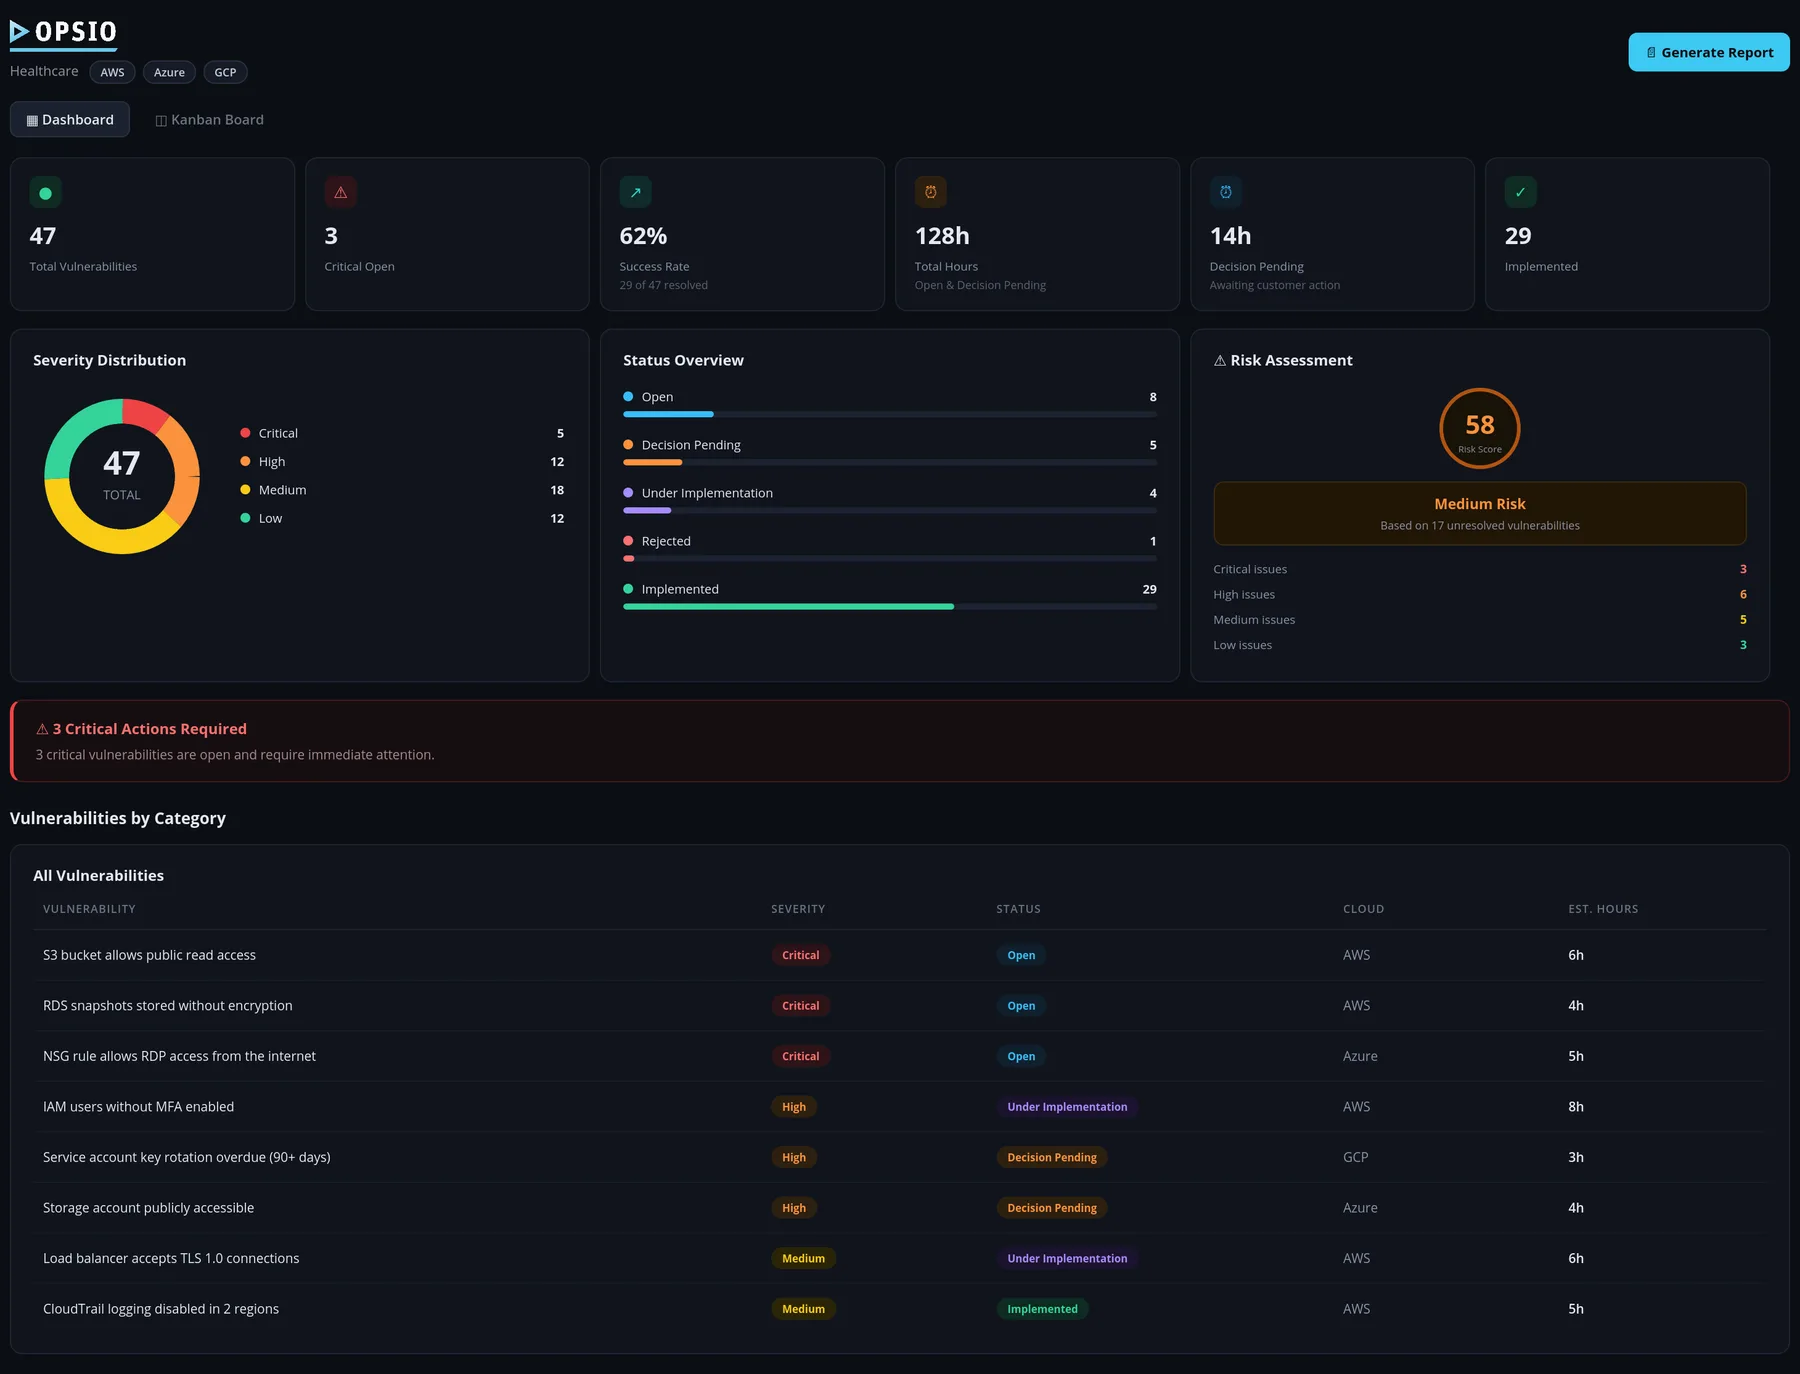
- Security posture, compliance score & multi-cloud spend on one live dashboard
- Cost anomalies & budget overruns caught before the invoice lands
- Auto-generated compliance evidence & vulnerability reports
- Encrypted secrets, mandatory MFA & row-level isolation by design
It's simply part of being an Opsio managed-cloud customer.
See Everything Fix Anything, Faster
Modern cloud environments generate millions of metrics, traces, and log lines per hour. Without unified observability, teams are stuck context-switching between tools, correlating timestamps manually, and diagnosing issues reactively. The result: extended outages, violated SLAs, and burned-out on-call engineers. Organizations with fragmented monitoring stacks report a mean time to detection (MTTD) that is 3-4x slower than those with unified observability, because the correlation between an application error, its infrastructure cause, and its user impact requires manual detective work across multiple dashboards. Opsio deploys Datadog to correlate infrastructure metrics, APM traces, and logs in a single view. Our implementations include custom dashboards for business KPIs, intelligent alerting that reduces noise by 80%, and automated runbooks that accelerate incident resolution. We do not just install Datadog — we make it the operational nervous system of your infrastructure. Every deployment includes a tagging strategy (environment, service, team, cost-center) that enables filtering, aggregation, and cost allocation across your entire estate.
Datadog works by deploying a lightweight agent on every host (EC2, VM, container, Kubernetes pod) that collects system metrics, application traces, and log data. The agent auto-discovers running services and configures integrations automatically — from PostgreSQL query performance to Redis cache hit rates to Nginx request latency. For Kubernetes environments, the Datadog Cluster Agent provides cluster-level metrics and orchestrates per-node agent configuration. APM tracing instruments your application code (Java, Python, Node.js, Go, .NET, Ruby, PHP) to capture distributed traces across microservice boundaries, showing exactly where latency originates in a flame graph visualization.
The business impact is measurable and immediate. Clients moving from fragmented monitoring to Opsio-managed Datadog typically see mean time to resolution (MTTR) drop by 60-70% within the first month. Alert noise decreases by 80% through composite monitors that correlate multiple signals before firing. One e-commerce client identified a database connection pool bottleneck within 2 hours of APM deployment that had been causing intermittent checkout failures for 3 months — the issue was invisible in their previous infrastructure-only monitoring. SLO tracking provides objective service reliability data that transforms engineering prioritization from opinion-based to data-driven.
Datadog is the ideal choice for organizations that want a single managed platform covering infrastructure metrics, APM, logs, synthetics, RUM, security monitoring, and CI visibility. It excels in multi-cloud and hybrid environments because of its 750+ integrations, and it is especially strong for teams running Kubernetes, microservices, or serverless architectures where distributed tracing is essential. The managed SaaS model means zero operational overhead for the monitoring platform itself — no servers to maintain, no upgrades to manage, no storage to provision.
However, Datadog is not the right fit for every scenario. Its per-host and per-GB pricing model can become expensive for large environments — organizations with 500+ hosts or high log volumes (10+ TB/month) should carefully model costs before committing. If you need full control over your monitoring data, long-term retention beyond 15 months, or must keep all telemetry within your own network for regulatory reasons, an open-source stack like Prometheus + Grafana + Loki is a better fit. For organizations that only need basic infrastructure monitoring without APM or logs, Datadog may be over-engineered — CloudWatch or Azure Monitor may suffice. Opsio helps you evaluate total cost of ownership across all options before recommending a platform. Featured reading from our knowledge base: Cloud Security Monitoring for Azure and AWS, and Elevate Your Business with Our Comprehensive Full Stack Development. Related Opsio services: Prometheus & Grafana — Open-Source Observability Stack, Terraform & IaC Services for India, and ELK Stack — Elasticsearch, Logstash & Kibana Log Management.
How Opsio Compares
| Capability | Datadog | New Relic | Prometheus + Grafana | Dynatrace |
|---|---|---|---|---|
| Deployment model | SaaS only | SaaS only | Self-hosted (open source) | SaaS or self-hosted |
| Infrastructure monitoring | 750+ integrations | 500+ integrations | Unlimited exporters (community) | OneAgent auto-discovery |
| APM / distributed tracing | Excellent (all major languages) | Excellent (all major languages) | Requires Jaeger/Tempo (separate) | Excellent (AI-powered) |
| Log management | Built-in with trace correlation | Built-in with trace correlation | Requires Loki (separate) | Built-in with AI analysis |
| Pricing model | Per-host + per-GB logs | Per-user + data ingest | Free (storage costs only) | Per-host (all-inclusive) |
| Kubernetes support | Excellent (Cluster Agent) | Good | Native (kube-state-metrics) | Excellent (Operator) |
| Cost at 200 hosts | $$ | $ | $ (storage only) | $$ |
| Operational overhead | None (SaaS) | None (SaaS) | Medium-High (self-managed) | None (SaaS) |
Ready to get started?
What You Get
Pricing & Investment Tiers
Transparent pricing. No hidden fees. Scope-based quotes.
Datadog Starter
$10,000–$25,000
Infrastructure monitoring with agent deployment, dashboards, and alerting
Datadog Professional
$30,000–$70,000
Full-stack: infrastructure + APM + logs + synthetics with cost optimization
Managed Datadog Operations
$5,000–$15,000/mo
24/7 monitoring, alert tuning, cost optimization, and incident triage
Transparent pricing. No hidden fees. Scope-based quotes.
Questions about pricing? Let's discuss your specific requirements.
Datadog Monitoring — Full-Stack Observability for Cloud Infrastructure
Free consultation