Remote Infrastructure Monitoring — 24/7 Visibility
Infrastructure failures at 3 AM should not mean a phone call to an on-call engineer who has to VPN in, guess what changed, and manually restart services. Opsio's remote infrastructure monitoring services provide 24/7 observability across your entire estate — cloud, on-premises, and hybrid — with automated remediation for common issues and human investigation for complex incidents.
Trusted by 100+ organisations across 6 countries
24/7
Monitoring
< 5min
Alert Response
60%
Auto-Remediated
99.9%
Uptime SLA
What's Included
Multi-Platform Monitoring
Unified monitoring across AWS, Azure, GCP, VMware, Linux, Windows, network devices, and SaaS applications. Single-pane-of-glass dashboards correlating metrics from cloud-native tools (CloudWatch, Azure Monitor) with third-party platforms (Datadog, Prometheus).
Automated Remediation
Runbook automation for common incidents: disk space cleanup, service restarts, SSL certificate renewal, DNS failover, auto-scaling triggers, and log rotation. Automated actions execute within seconds and are logged for audit trails.
Alert Management & Noise Reduction
Intelligent alert correlation and deduplication using PagerDuty or Opsgenie. Severity-based routing, maintenance window suppression, and escalation chains ensuring the right person is notified at the right time — not alert fatigue from thousands of emails.
Performance Baselining & Capacity Planning
Historical trend analysis to establish performance baselines and predict capacity requirements. Proactive alerts when resources approach thresholds — before they impact service availability — with recommendations for scaling or optimization.
Opsio is our partner for IT operations and cyber security – a crucial part of our business. We roast 12 million cups of coffee each day, and therefore have high demands for availability and reliability to deliver the best possible quality for our customers. Our partnership with Opsio is vital for us to succeed with this central function.
Magnus Norman
Head of IT · Löfbergs
Two enterprise security platforms. Included free.
Others pay a fortune for continuous vulnerability monitoring and a unified security-and-cost workspace — and then pay again for the people to run them. Every Opsio managed-cloud customer gets both, at no extra cost, with our engineers acting on what they surface.
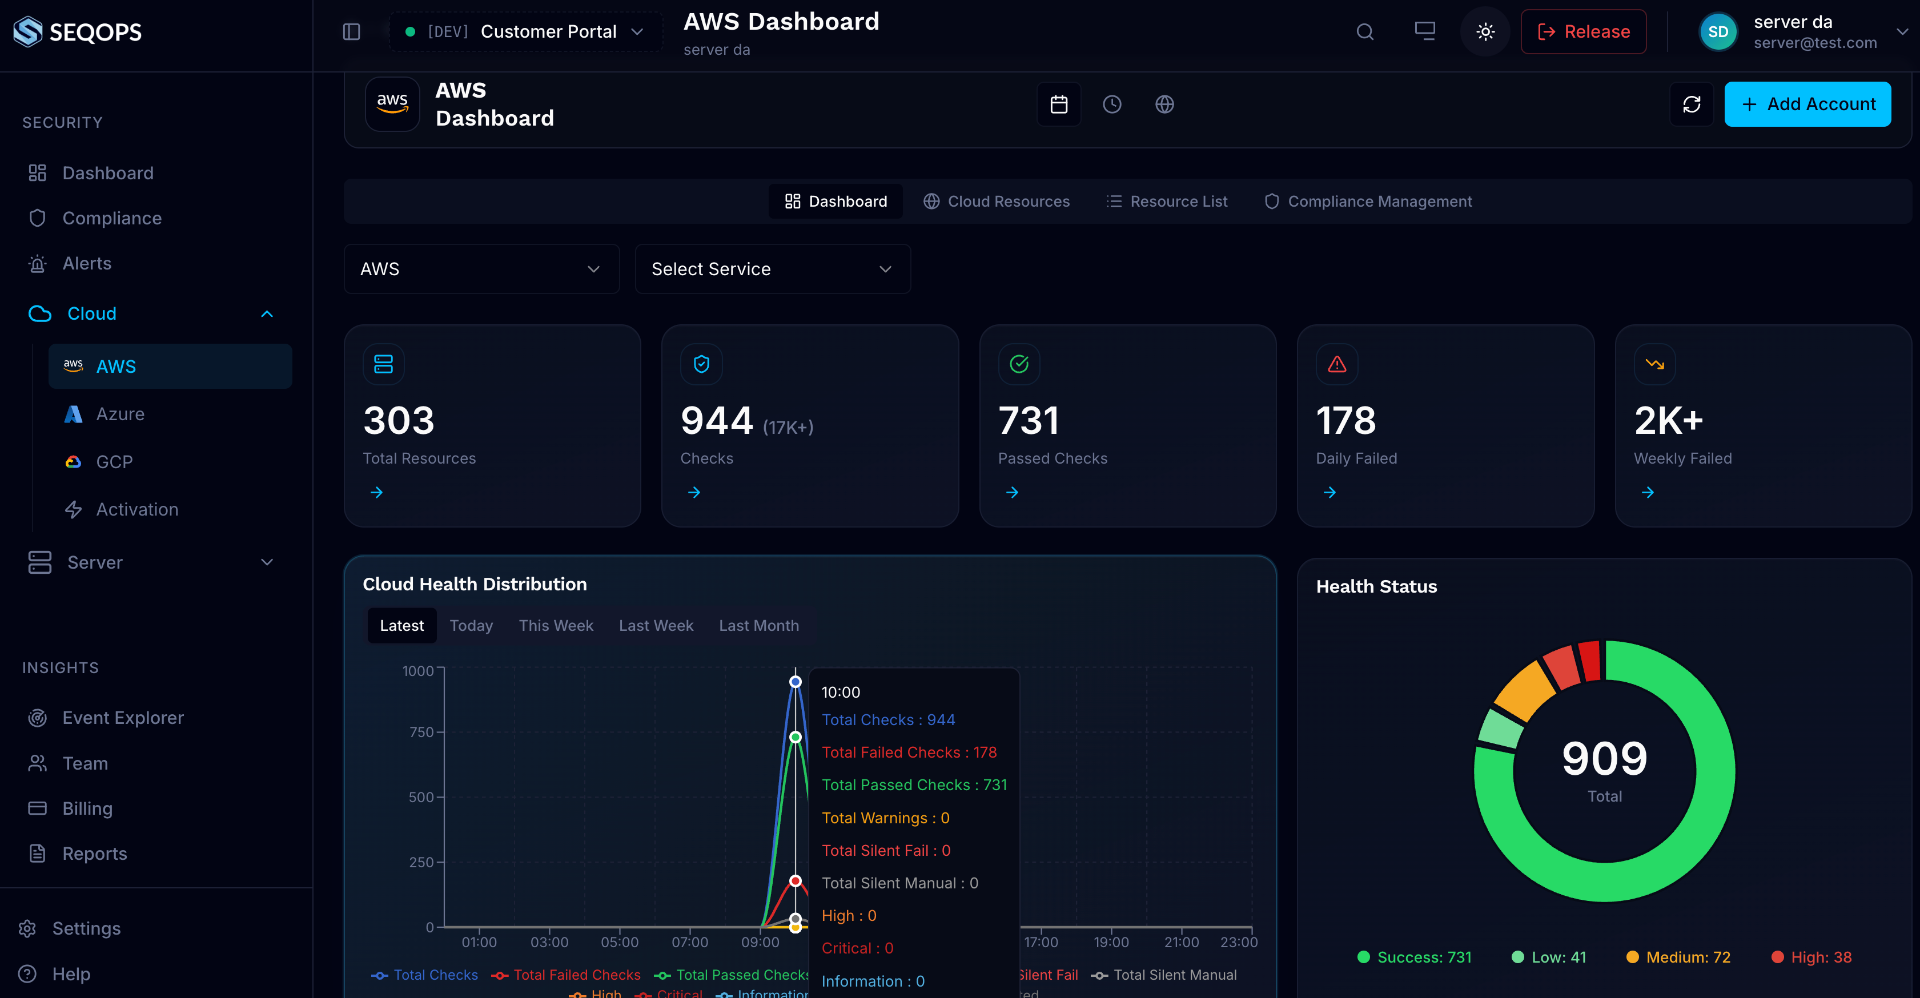
SeqOps
Continuous vulnerability monitoring across your entire cloud & server estate — always on, never in the way.
- Every vulnerability, misconfiguration & exposure found continuously across AWS, Azure, GCP, Windows & Linux
- AI ranks findings by real risk, so effort goes where it matters
- Continuous compliance scoring: NIS2 · ISO 27001 · GDPR · PCI · HIPAA
- Read-only — collects security metadata, never your data
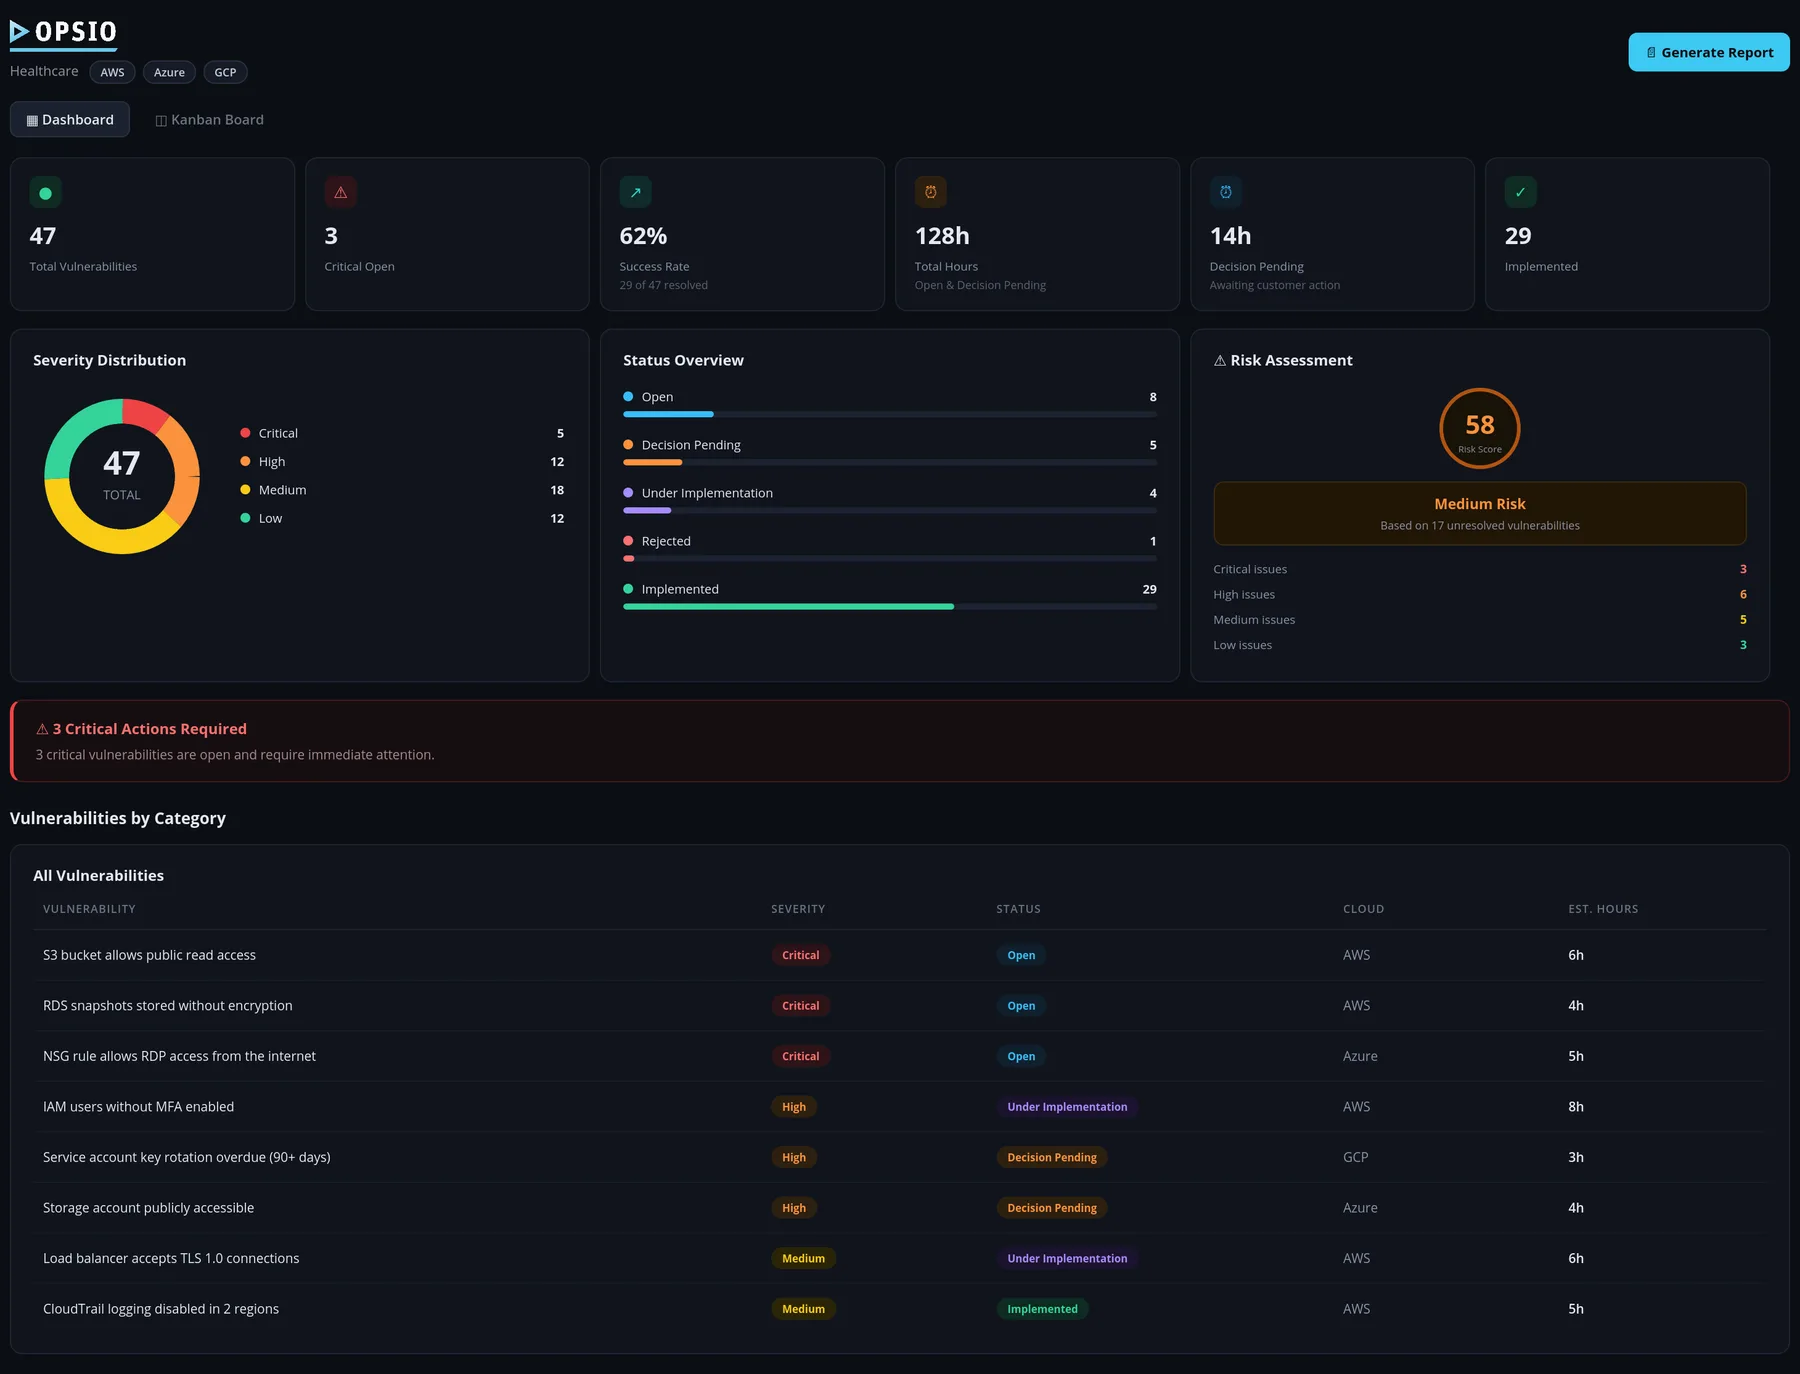
Opsio Shield
One intelligent workspace that unifies security posture, compliance scoring and cloud cost — so nothing hides between tools.
- Security posture, compliance score & multi-cloud spend on one live dashboard
- Cost anomalies & budget overruns caught before the invoice lands
- Auto-generated compliance evidence & vulnerability reports
- Encrypted secrets, mandatory MFA & row-level isolation by design
It's simply part of being an Opsio managed-cloud customer.
Always-On Remote Infrastructure Monitoring
Infrastructure monitoring is only valuable when someone is watching and ready to act. Many organizations have monitoring tools deployed but no one actively watching dashboards outside business hours. Alerts go to email inboxes that are not checked until morning. By then, a minor disk space issue has cascaded into a database crash, a service outage, and angry customers. The gap is not technology — it is operational coverage. This page is specifically about the monitoring practice: tooling, on-call rotation, alert engineering, and observability operations. For full umbrella IT operations (where monitoring is one of many services bundled), see our managed service provider page. Opsio's remote infrastructure monitoring services close this gap with 24/7 human-staffed operations backed by automated remediation. We deploy and operate monitoring across servers, databases, network devices, cloud services, containers, and applications using Datadog, CloudWatch, Azure Monitor, Prometheus, and Zabbix. Our platform correlates alerts, suppresses noise, and executes automated runbooks for known issues — disk cleanup, service restarts, scaling actions — while routing complex alerts to certified engineers for investigation. Where customers have already standardised on a specific observability platform, we operate it natively rather than forcing a tool migration — including the dedicated Datadog managed service we offer for customers committed to that platform.
The result is dramatically reduced mean time to detect (MTTD) and mean time to resolve (MTTR). Our clients see 60% of incidents auto-remediated without human intervention, 90% of remaining incidents resolved within 30 minutes, and a steady decline in total incident volume as we identify and fix root causes rather than repeatedly treating symptoms. Mean time to acknowledge (MTTA) drops below 5 minutes because alerts route to engineers on shift, not to a shared inbox that nobody owns.
Modern observability is no longer just metrics-and-alerts; it is the discipline of SLI definition, SLO targeting, and error-budget management — the practice that connects engineering work to user-visible reliability outcomes. Opsio's monitoring engagements start by defining the SLIs that matter to each customer (request latency percentile, error rate, queue depth, replication lag), agreeing SLO targets that map to business priority, and configuring the alerting layer to fire on SLO burn-rate rather than on raw threshold breaches. This is the methodology described in our SLA monitoring review post (cloud SLA monitoring), applied to every monitored environment. The result is far less alert fatigue and far more time spent on the small set of alerts that genuinely matter.
On-call rotation models vary widely. Some customers want Opsio to be the entire on-call rotation; others want us to be tier-1 with their engineers as tier-2 escalation; others want shared rotation where their engineers handle business hours and Opsio takes nights and weekends. We support all three models — what matters is that the handoff between tiers is documented, that escalation paths are tested quarterly, and that the rotation is observable (response times, escalation rates, and unresolved alerts tracked weekly). Observability cost is also a first-class concern: log volume, custom metrics, and retention drive bills that can rival the underlying compute they are watching, which is why every monitoring engagement includes a cost-review track aligned with our cloud cost optimization dashboard methodology. Featured reading from our knowledge base: Remote Monitoring Service Provider: 24/7 Infrastructure Visibility, Reliable Remote Monitoring Solutions for Your Business, and What Are the Key Benefits of SLA Monitoring in the Cloud?. Related Opsio services: IT Infrastructure Service Provider, Azure Infrastructure as a Service — Managed IaaS, and Cloud Infrastructure Consulting — Multi-Cloud Design.
How Opsio Compares
| Capability | In-house SRE team | Generic NOC outsourcer | Opsio monitoring |
|---|---|---|---|
| Coverage model | On-call rota across 2-4 SRE FTEs | Eyes-on-glass, limited investigation | 24/7 NOC, runbook-driven auto-remediation + human escalation |
| Observability stack | Whatever the SRE team picked | Vendor-prescribed, one tool only | Datadog, Grafana, Splunk, Prometheus — native operation of each |
| Alert engineering | Ad-hoc threshold rules | Default rules, frequent noise | SLO burn-rate alerting, weekly review, 70-85% noise reduction |
| Auto-remediation | Manual scripts, brittle | Rare, billed extra | 60%+ of incidents resolved without human, included in base price |
| Multi-cloud correlation | Per-cloud tools, no correlation | Per-cloud silos | Single dashboard correlating AWS, Azure, GCP, and on-prem |
| Cost-of-observability discipline | Unmanaged | Unmanaged | Continuous review against the cloud cost optimization dashboard methodology |
| Monthly run rate (mid-market) | USD 60K-100K loaded staff cost | USD 4K-8K per month, eyes-on-glass only | USD 5K-15K per month, full operational ownership |
Ready to get started?
Remote Infrastructure Monitoring — 24/7 Visibility
Free consultation