Prometheus & Grafana — Open-Source Observability Stack
Prometheus and Grafana are the industry standard for cloud-native observability — battle-tested by the largest Kubernetes deployments in the world. Opsio implements production-grade Prometheus stacks with Thanos or Cortex for long-term storage, Grafana dashboards for every team, and Alertmanager configurations that actually wake the right person.
Trusted by 100+ organisations across 6 countries
CNCF
Graduated
0
License Cost
PromQL
Query Language
∞
Customization
What's Included
Prometheus Deployment
Production-hardened Prometheus deployed via the Prometheus Operator with service discovery, relabeling rules, and recording rules optimized for Kubernetes and cloud workloads. We configure retention policies, TSDB storage sizing, WAL configuration, and scrape interval optimization to balance metric resolution with resource consumption. High availability is achieved through Prometheus replicas with Thanos deduplication.
Thanos / Cortex Long-Term Storage
Long-term metrics storage, global query view across clusters, and automatic downsampling for cost-effective retention. Thanos sidecar uploads Prometheus blocks to S3/GCS/Azure Blob, and the Thanos Query component provides a unified PromQL endpoint across all clusters. We configure compaction, retention policies, and bucket lifecycle rules to optimize storage costs while maintaining query performance.
Grafana Dashboards & Visualization
Custom dashboards for infrastructure health, application performance, business metrics, and SLO tracking with role-based access control. We build dashboards using Grafana best practices — template variables for dynamic filtering, annotation layers for deployment markers, and alert panels for at-a-glance status. Grafana is configured with LDAP/OIDC authentication and folder-based permissions so each team sees only their relevant dashboards.
Alertmanager & Escalation
Multi-tier alerting with routing trees, silences, inhibition rules, and integrations with PagerDuty, Slack, OpsGenie, and Microsoft Teams. We design alert routing hierarchies that match your on-call structure — critical infrastructure alerts go to SRE, application-specific alerts go to the owning team, and business metric alerts go to stakeholders. Inhibition rules prevent alert storms during known outages.
Custom Exporters & Instrumentation
Custom Prometheus exporters for applications, databases, message queues, and legacy systems that do not natively expose metrics. We build exporters in Go or Python using the Prometheus client library, instrument application code with custom metrics (counters, gauges, histograms, summaries), and configure recording rules that pre-aggregate expensive queries for dashboard performance.
Loki & Tempo Integration
Grafana Loki for log aggregation with label-based querying that integrates seamlessly with Prometheus metrics. Grafana Tempo for distributed tracing with trace-to-metrics and trace-to-logs correlation. We deploy the complete Grafana LGTM stack (Loki, Grafana, Tempo, Mimir) for organizations wanting full-stack open-source observability without any commercial dependencies.
Opsio's focus on security in the architecture setup is crucial for us. By blending innovation, agility, and a stable managed cloud service, they provided us with the foundation we needed to further develop our business. We are grateful for our IT partner, Opsio.

Jenny Boman
CIO · Opus Bilprovning
Two enterprise security platforms. Included free.
Others pay a fortune for continuous vulnerability monitoring and a unified security-and-cost workspace — and then pay again for the people to run them. Every Opsio managed-cloud customer gets both, at no extra cost, with our engineers acting on what they surface.
SeqOps
Continuous vulnerability monitoring across your entire cloud & server estate — always on, never in the way.
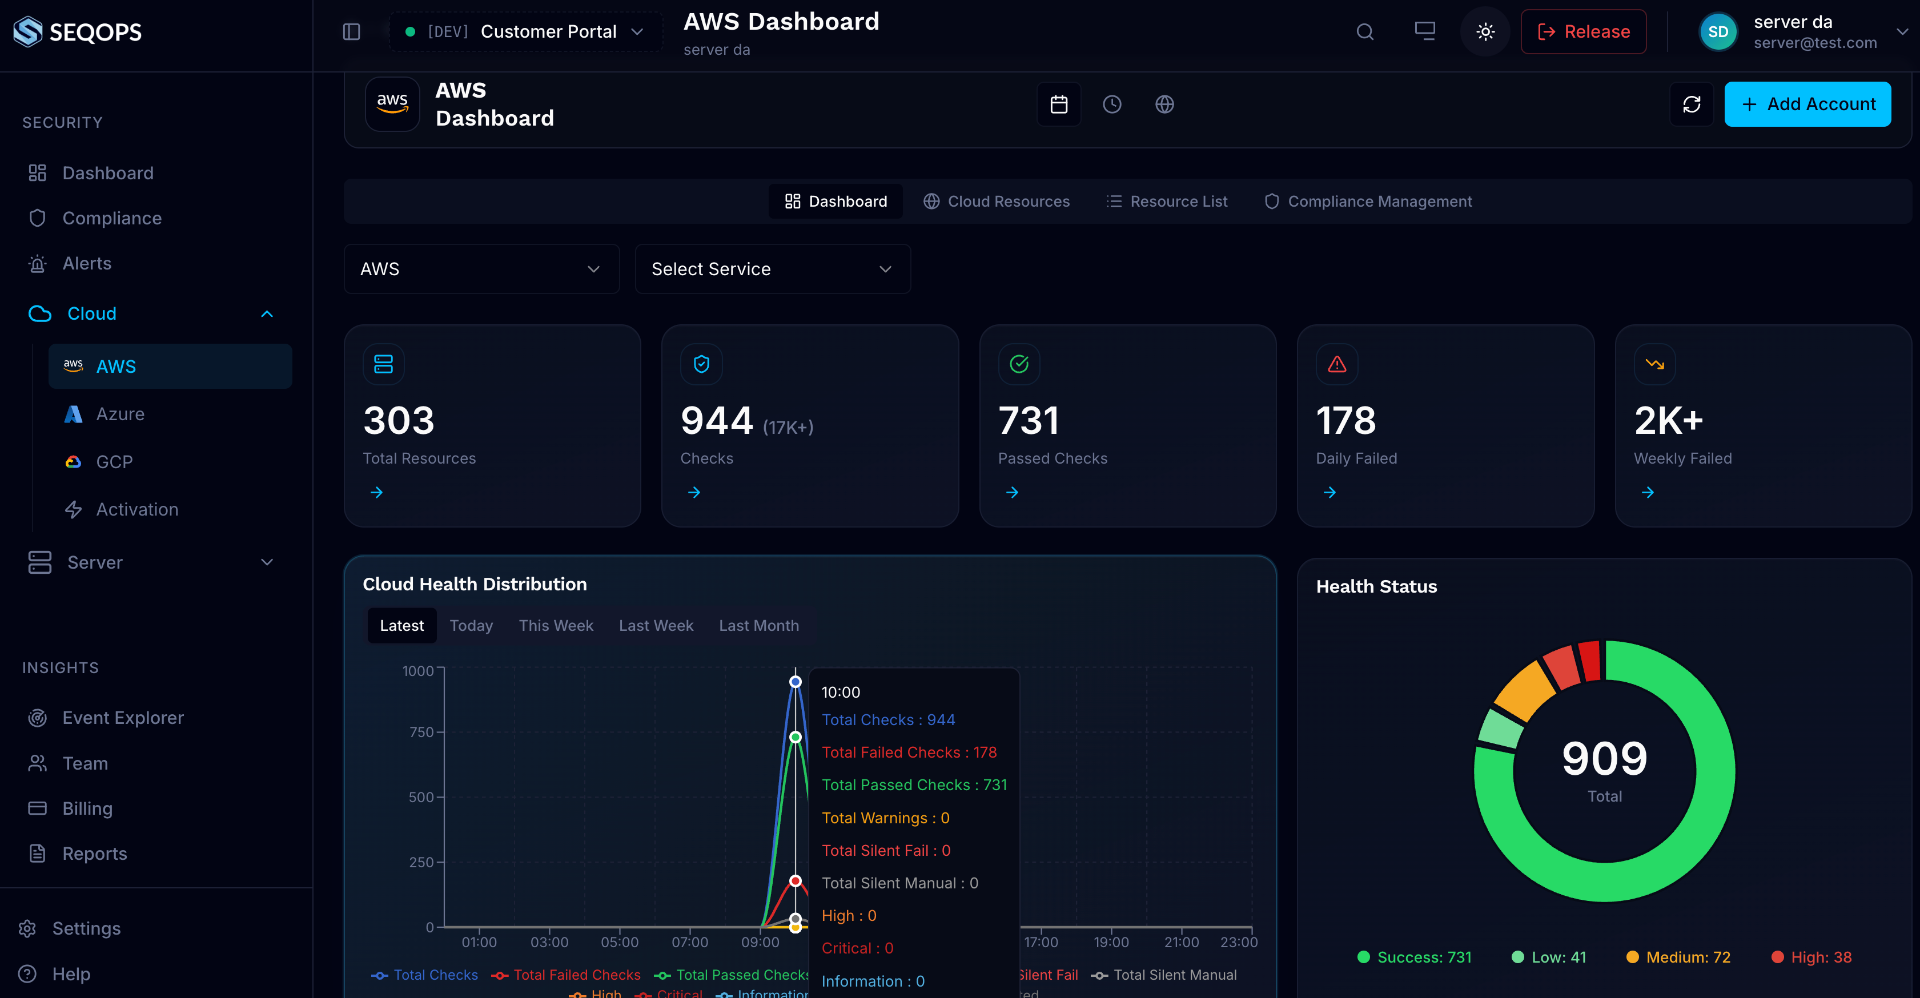
- Every vulnerability, misconfiguration & exposure found continuously across AWS, Azure, GCP, Windows & Linux
- AI ranks findings by real risk, so effort goes where it matters
- Continuous compliance scoring: NIS2 · ISO 27001 · GDPR · PCI · HIPAA
- Read-only — collects security metadata, never your data
Opsio Shield
One intelligent workspace that unifies security posture, compliance scoring and cloud cost — so nothing hides between tools.
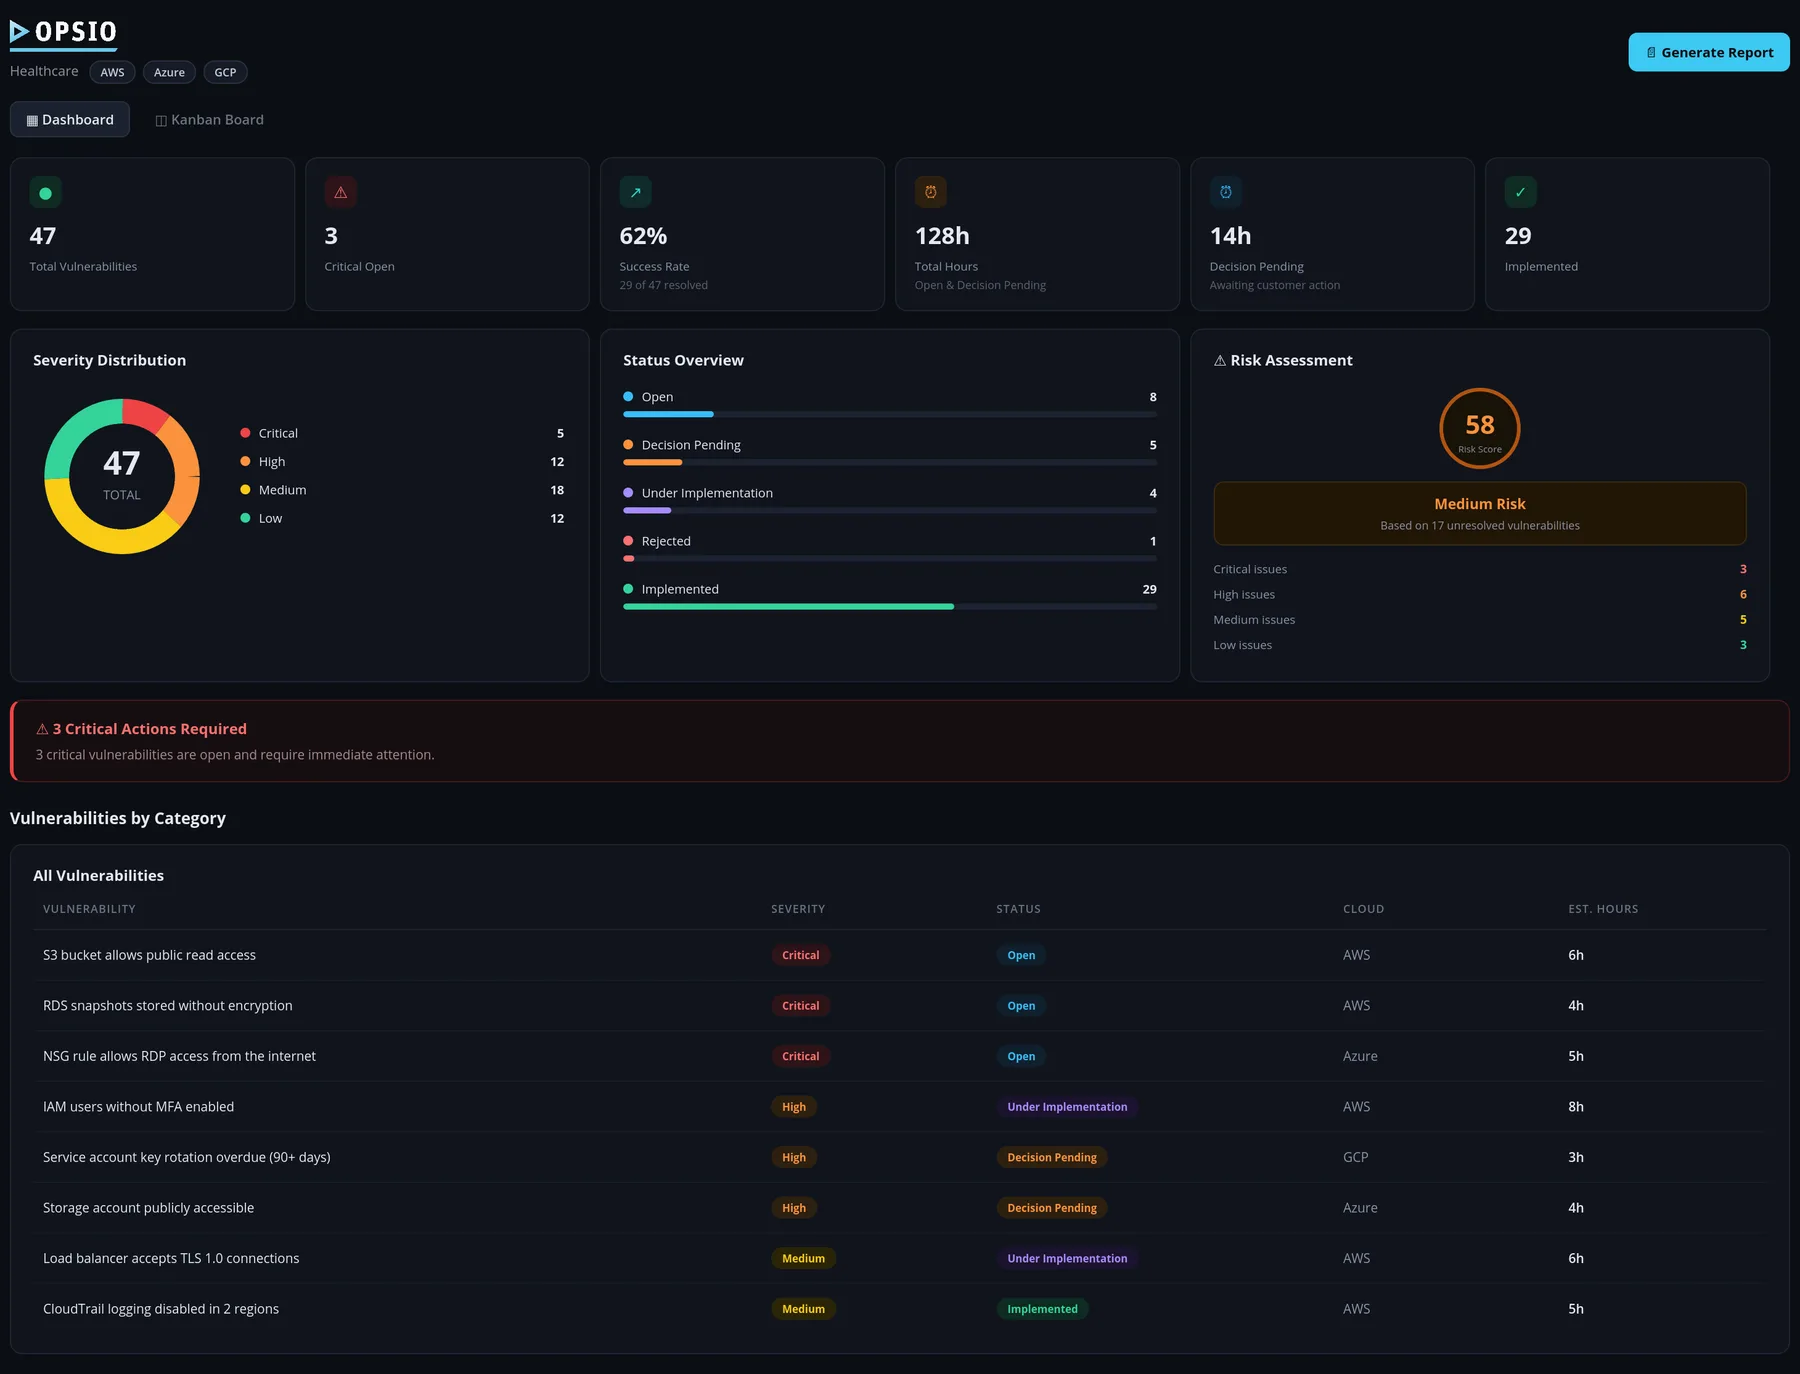
- Security posture, compliance score & multi-cloud spend on one live dashboard
- Cost anomalies & budget overruns caught before the invoice lands
- Auto-generated compliance evidence & vulnerability reports
- Encrypted secrets, mandatory MFA & row-level isolation by design
It's simply part of being an Opsio managed-cloud customer.
Monitor Everything without Vendor Lock-In
Vendor-locked monitoring solutions create budget pressure that forces teams to make impossible trade-offs — monitor fewer services, retain less data, or sacrifice alert granularity. As your infrastructure grows, per-host pricing models can turn observability into one of your largest cloud expenses. A company monitoring 500 hosts with a commercial SaaS platform typically spends $120,000-$200,000 per year on licensing alone — before adding APM, logs, or additional features. At 2,000 hosts, that figure can exceed $500,000 annually. Opsio implements the Prometheus + Grafana stack to give you unlimited metrics, unlimited dashboards, and unlimited users — with zero per-host licensing. We add enterprise-grade features through Thanos for global view and long-term storage, Alertmanager for sophisticated routing, and Grafana for cross-team visibility. The only costs are compute and storage for running the stack itself, which typically amounts to 10-20% of equivalent commercial platform pricing at scale.
Prometheus works on a pull model — it scrapes metrics from instrumented targets at configurable intervals (typically 15-30 seconds). For Kubernetes environments, Prometheus uses ServiceMonitor CRDs to auto-discover pods and services, while node-exporter and kube-state-metrics provide host and cluster-level metrics out of the box. Applications expose metrics via /metrics endpoints using client libraries for Go, Java, Python, Node.js, and every major language. The data is stored as time-series in Prometheus's custom TSDB, optimized for write-heavy workloads and fast range queries. PromQL provides a powerful query language for aggregation, rate calculation, histogram analysis, and prediction.
For production environments that need long-term retention, multi-cluster visibility, and high availability, we deploy Thanos or Cortex on top of Prometheus. Thanos uses a sidecar model that uploads Prometheus blocks to object storage (S3, GCS, Azure Blob) and provides a global query endpoint across multiple Prometheus instances. Cortex provides a horizontally-scalable, multi-tenant Prometheus backend. Both solutions enable months or years of metrics retention with automatic downsampling (5-minute and 1-hour resolution for older data) that keeps storage costs manageable. Clients retaining 13 months of metrics for capacity planning and YoY comparison typically spend $200-$500/month on object storage.
The Prometheus + Grafana stack is the ideal choice for Kubernetes-native organizations, teams with strong engineering cultures that value customization, environments where per-host licensing is prohibitively expensive, and organizations that require full data sovereignty with all telemetry remaining within their own infrastructure. It integrates natively with the entire CNCF ecosystem — OpenTelemetry, Jaeger, Loki, Tempo, and every Kubernetes component exposes Prometheus-format metrics. Grafana supports over 100 data sources, so it can also visualize CloudWatch, Datadog, Elasticsearch, and InfluxDB data alongside Prometheus metrics.
However, Prometheus is not the right choice for every organization. It requires operational effort to deploy, scale, upgrade, and maintain — unlike SaaS platforms that are fully managed. Teams without Kubernetes experience or strong infrastructure engineering capabilities may find the learning curve steep. Prometheus does not provide built-in APM distributed tracing (you need Jaeger or Tempo separately), log management (you need Loki separately), or synthetic monitoring — so achieving full-stack observability requires assembling multiple tools. For organizations that prioritize a single-vendor, all-in-one experience with zero operational overhead, Datadog or Dynatrace is a better fit. Opsio helps you evaluate the total cost of ownership including both licensing and operational costs before recommending a platform. Related Opsio services: Datadog Monitoring — Full-Stack Observability for Cloud Infrastructure, and ELK Stack — Elasticsearch, Logstash & Kibana Log Management.
How Opsio Compares
| Capability | Prometheus + Grafana | Datadog | New Relic | Amazon CloudWatch |
|---|---|---|---|---|
| Licensing cost | Free (open source) | $15-23/host/month + extras | Per-user + data ingest | Pay-per-metric |
| Cost at 500 hosts (annual) | $30-60K (infra + ops) | $120-200K | $100-180K | $40-80K (basic) |
| Customization | Unlimited (open source) | Limited to platform features | Limited to platform features | Limited to AWS services |
| Kubernetes support | Native (Operator, CRDs) | Good (Cluster Agent) | Good | Basic (Container Insights) |
| Long-term retention | Unlimited (Thanos/Cortex + object storage) | 15 months max | 13 months max | 15 months max |
| Data sovereignty | Full (self-hosted) | SaaS (US/EU regions) | SaaS (US/EU regions) | AWS regions only |
| APM / tracing | Requires Tempo/Jaeger (separate) | Built-in | Built-in | X-Ray (separate) |
| Operational overhead | Medium-High (self-managed) | None (SaaS) | None (SaaS) | Low (AWS managed) |
Ready to get started?
What You Get
Pricing & Investment Tiers
Transparent pricing. No hidden fees. Scope-based quotes.
Monitoring Assessment
$8,000–$18,000
Architecture design, tool selection, and migration planning
Prometheus + Grafana Implementation
$25,000–$55,000
Full stack with Thanos, Alertmanager, dashboards, and alerting
Managed Monitoring Operations
$4,000–$12,000/mo
24/7 stack operations, capacity planning, and alert tuning
Transparent pricing. No hidden fees. Scope-based quotes.
Questions about pricing? Let's discuss your specific requirements.
Prometheus & Grafana — Open-Source Observability Stack
Free consultation