Continuous server monitoring is the practice of collecting and analyzing infrastructure metrics around the clock to detect issues before they reach end users. For organizations running always-on services, it is no longer optional. Downtime costs mid-sized businesses an average of $5,600 per minute according to Gartner research, and most of that damage is preventable with the right monitoring strategy in place. This guide covers the server monitoring best practices that operations teams need in 2026, from choosing the right metrics and alerting policies to selecting tools, maintaining uptime, and building a culture of continuous improvement.
Why Continuous Server Monitoring Matters

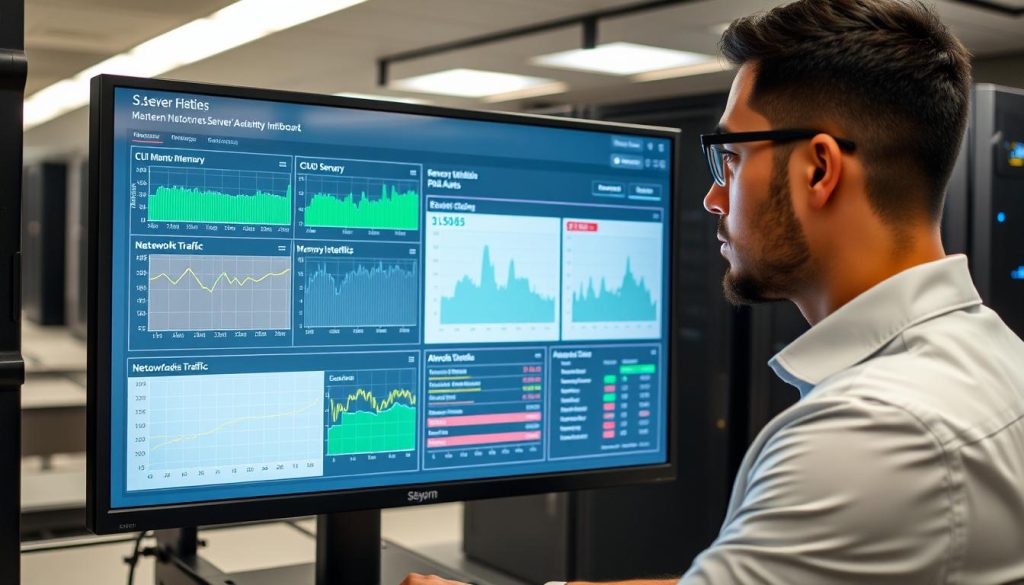
Continuous monitoring provides real-time visibility into critical server metrics
Real-time server monitoring replaces guesswork with data, giving teams the visibility needed to act before users notice a problem. Unlike periodic health checks that only sample system state at fixed intervals, continuous monitoring streams metrics, logs, and traces in near real time. This eliminates dangerous blind spots where transient CPU spikes, memory leaks, or network packet loss could go undetected for minutes or hours.
Key Benefits
- Faster incident detection and a measurably lower mean time to repair (MTTR)
- More accurate capacity planning based on actual usage trends rather than estimates
- Early anomaly detection that strengthens security posture
- Proactive performance tuning that directly improves customer experience
- Lower operational costs by preventing emergency interventions and unplanned overtime
Risks of Monitoring Gaps
- Transient issues such as brief disk I/O spikes or garbage collection pauses go unrecorded between polling intervals
- Delayed detection extends the blast radius of incidents, increasing customer impact and recovery cost
- Capacity planning becomes unreliable when based on incomplete data, leading to overprovisioning or surprise resource exhaustion
- Security threats like unauthorized access attempts or data exfiltration may go unnoticed without continuous log analysis
Organizations with mature monitoring practices experience significantly fewer unplanned outages. A 2024 Atlassian Incident Management report found that teams using continuous monitoring reduced incident resolution time by up to 70% compared to teams relying on manual checks. For many businesses, the investment in server health monitoring pays for itself through prevented downtime alone.
Core Principles of Effective Server Monitoring
Define Monitoring Objectives and SLOs First
Every monitoring strategy should start with clearly defined Service Level Objectives (SLOs) that tie technical metrics to business outcomes. Instead of simply watching CPU utilization, define targets like “99.95% availability for the checkout API” or “95% of requests complete in under 200 ms.” These business-aligned objectives give your DevOps team clear thresholds to act on.

“You can’t improve what you don’t measure, and you can’t measure what you haven’t defined. Clear SLOs are the foundation of effective monitoring.”
Google SRE Book
Choose the Right Metrics Across Three Dimensions
Selecting the right metrics is as important as collecting them. Organize your server performance monitoring around three layers:
Performance Metrics
- Request latency (p50, p95, p99)
- Throughput (requests per second)
- Response times by endpoint
- Database query duration
Availability Metrics
- Successful response rate
- Uptime percentage
- Error rates (5xx, 4xx)
- Health check status
Resource Usage Metrics
- CPU utilization
- Memory consumption
- Disk I/O and free space
- Network bandwidth and packet loss
Beyond these basics, track derivative metrics like error budgets, connection pool churn, and garbage collection pause times. The most effective monitoring setups correlate these metrics directly with user experience indicators such as Apdex scores and page load times.
Design Alerting That Reduces Noise
Alert fatigue is one of the fastest ways to undermine a monitoring program. When on-call engineers receive hundreds of non-actionable alerts per shift, they start ignoring all of them. Design your alerting strategy around these principles:
- Alert only on conditions that require human intervention
- Use multi-condition rules to cut false positives (for example, high latency and rising error rate)
- Assign severity levels (P1, P2, P3) with matching escalation paths
- Include runbook links in every alert so responders can act immediately
- Configure silence windows during planned maintenance
Monitoring Strategies for Reliable Systems
Proactive vs. Reactive Monitoring
The strongest monitoring programs combine proactive trend analysis with fast reactive incident response. Relying solely on reactive monitoring creates a firefighting culture where teams are always catching up. Proactive monitoring, by contrast, identifies problems before they affect users.
| Aspect |
Proactive Monitoring |
Reactive Monitoring |
| Focus |
Leading indicators and trends |
Incident detection and response |
| Timing |
Before issues impact users |
After issues are detected |
| Typical Metrics |
Capacity trends, saturation forecasts |
Error rates, availability drops |
| Main Benefit |
Prevents incidents and reduces downtime |
Resolves issues quickly when they occur |
| Challenge |
Requires deeper analysis and planning |
Can lead to burnout and firefighting cycles |
Layered Monitoring: Infrastructure, Application, and User Experience
A single monitoring layer is never enough. Infrastructure metrics may look healthy while the application layer is silently dropping requests. Implement monitoring across all three layers to catch issues wherever they originate:
Infrastructure Layer
- Host metrics (CPU, memory, disk)
- Network health and throughput
- Storage I/O and capacity
- Hardware and hypervisor status
Application Layer
- APM traces and transaction times
- Thread pools and queue depths
- Database query performance
- Service dependency health
User Experience Layer
- Synthetic transaction checks
- Real User Monitoring (RUM)
- Frontend Core Web Vitals
- User journey completion rates
Correlating signals across layers is where the real value emerges. For example, a spike in application-layer latency combined with high disk I/O at the infrastructure layer quickly points to a storage bottleneck, something neither layer would reveal on its own.
Integrating Monitoring into CI/CD Pipelines
Embedding monitoring into your deployment workflow creates a feedback loop that catches regressions early. Run synthetic health checks as a CI/CD gate, add performance budgets to pull requests, and implement canary releases with automated rollback triggers. This approach turns monitoring from a post-deployment afterthought into a continuous quality signal throughout the software lifecycle. Teams practicing cloud incident response planning benefit especially from this integration.
Server Performance Monitoring Techniques
Essential KPIs and How to Measure Them
The four golden signals, latency, traffic, errors, and saturation, remain the most reliable starting point for server performance monitoring. Here is how to implement each one effectively:
- Latency percentiles: Track p50, p95, and p99 request latency. The p99 often reveals problems hidden by averages.
- Error rates: Monitor 5xx and 4xx errors per endpoint. A sudden change in the ratio of 4xx to 5xx errors can signal a different class of failure.
- Throughput: Measure requests per second (RPS) and compare to historical baselines to detect abnormal load patterns.
- Resource saturation: Track CPU, memory, disk, and network utilization. When any resource consistently exceeds 80% utilization, capacity planning must begin.
- Apdex score: Calculate an application performance index to quantify user satisfaction as a single number between 0 and 1.
Collect these metrics using time-series databases like Prometheus, VictoriaMetrics, or InfluxDB and visualize them with Grafana. Set retention periods that balance storage costs with the need for long-term trend analysis, typically 15 days at full resolution and 12 months at aggregated resolution.
Profiling, Tracing, and Log Correlation
When an alert fires, you need multiple telemetry types working together to find the root cause fast. Profiling reveals CPU and memory hotspots in code. Distributed tracing follows individual requests across microservices. Log correlation connects structured log entries with trace IDs so you can see the full story of a failed request in one view.
OpenTelemetry has become the industry standard for vendor-neutral instrumentation in 2026, supported by every major observability platform. Adopting it early avoids vendor lock-in and simplifies future tool migrations.
Capacity Planning and Trend Analysis
Historical metrics are the raw material for preventing resource exhaustion before it happens. Review utilization trends monthly and before any major traffic event. Maintain at least 20–30% spare capacity for unexpected bursts. Use predictive autoscaling based on historical patterns rather than purely reactive scaling, which always responds too late during sudden traffic spikes. For managed AWS environments, cloud-native auto-scaling groups combined with custom CloudWatch metrics offer a practical starting point.
Monitoring Server Uptime Effectively
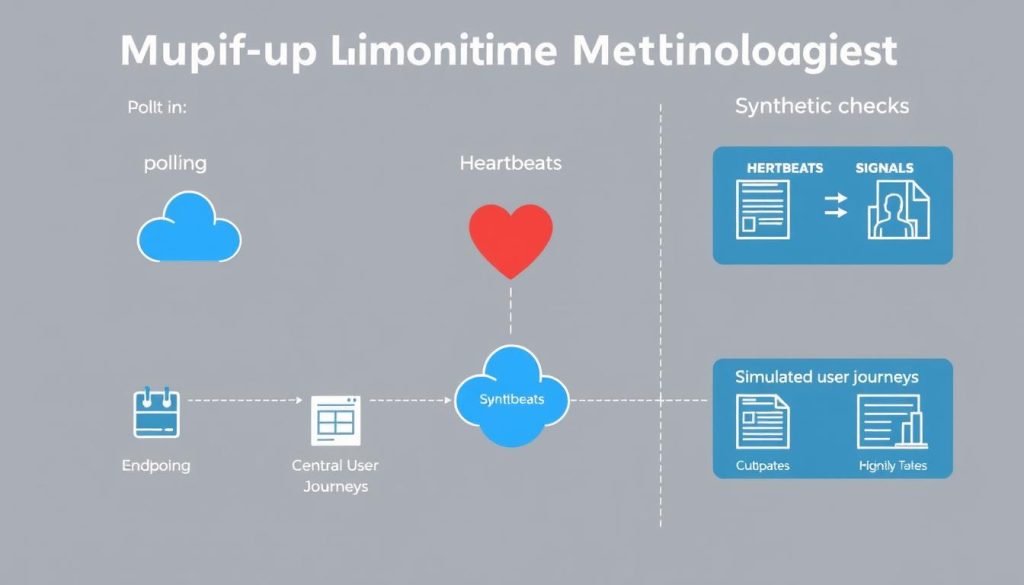
Three Complementary Uptime Methods
No single uptime check method is sufficient on its own. Combine these three approaches for complete coverage:
External Polling
Probes from outside your network check endpoints at fixed intervals.
- HTTP/HTTPS status checks
- TCP port availability
- DNS resolution verification
Heartbeats
Services push “I’m alive” signals to a central collector on a schedule.
- Push-based health reporting
- Dead man’s switch patterns
- Cron and batch job monitoring
Synthetic Checks
Scripted transactions simulate real user behavior end to end.
- Multi-step user journey simulation
- API transaction validation
- Cross-region availability tests

Setting Realistic SLAs
Your SLA target should reflect both business requirements and engineering reality. The table below shows common availability tiers and the downtime each permits per month:
| SLA Level |
Uptime |
Monthly Downtime |
Typical Use Case |
| Standard |
99.9% |
43 minutes |
Internal business applications |
| High |
99.95% |
22 minutes |
E-commerce, SaaS platforms |
| Premium |
99.99% |
4.3 minutes |
Financial services, critical APIs |
| Mission Critical |
99.999% |
26 seconds |
Emergency services, core infrastructure |
Tie error budgets to release policies. When the remaining error budget drops below a threshold, freeze non-critical deployments until the system stabilizes. This creates a natural governance mechanism that balances velocity with reliability.
Blameless Post-Mortems for Continuous Improvement
Every incident is an opportunity to strengthen your monitoring coverage. After resolution, conduct a blameless post-mortem that documents the timeline, root cause, and detection gaps. Calculate MTTD (Mean Time to Detect) and MTTR (Mean Time to Resolve), then update runbooks and alerting thresholds based on what you learn. Teams that systematically follow this practice, a core tenet of Site Reliability Engineering, see measurable reductions in recurring incidents over time.
Server Monitoring Tools and Solutions
Open-Source vs. Commercial Platforms
The right tool depends on your team size, budget, and environment complexity. Here is how the most widely adopted server monitoring solutions compare in 2026:

| Tool |
Type |
Strengths |
Best For |
Limitations |
| Prometheus + Grafana |
Open-Source |
Powerful PromQL, rich dashboards, large ecosystem |
Kubernetes and cloud-native stacks |
Requires operational investment to scale |
| OpenTelemetry |
Open-Source |
Vendor-neutral instrumentation standard |
Multi-service tracing and metrics collection |
Needs a separate backend for storage and visualization |
| Datadog |
Commercial |
Full-stack observability, APM, log management |
Enterprise environments needing unified monitoring |
Cost scales quickly with metric volume |
| New Relic |
Commercial |
Strong APM, real user monitoring, generous free tier |
Application-centric monitoring |
Pricing complexity at enterprise scale |
| Dynatrace |
Commercial |
AI-driven root cause analysis, auto-discovery |
Large enterprises with complex hybrid environments |
Higher cost and steeper learning curve |
Many organizations adopt a hybrid model, using open-source collectors (Prometheus, OpenTelemetry) with a commercial analytics backend. This balances cost control with enterprise-grade querying and visualization. For teams managing security monitoring alongside infrastructure monitoring, integrated platforms like Datadog and Dynatrace reduce context-switching.
How to Evaluate Monitoring Tools
Before committing to any platform, run a proof-of-concept with representative production workloads. Evaluate against these criteria:

- Scalability: Can it handle your metric cardinality and retention requirements as your infrastructure grows?
- Integrations: Does it support your cloud providers, container orchestrators, databases, and CI/CD pipeline?
- Alerting sophistication: Does it support multi-condition alerts, deduplication, and on-call rotation?
- Total cost of ownership: Include storage, data ingestion, and the engineering hours needed to operate the tool.
- Security and compliance: Verify encryption in transit and at rest, RBAC, and audit logging meet your regulatory requirements.
Implementation Roadmap
Phased Rollout: Pilot, Expand, Optimize
Rolling out monitoring in phases reduces risk and builds organizational confidence at each stage.
Phase 1: Pilot (2–4 weeks)
- Instrument 2–3 critical services
- Validate metrics, dashboards, and alerting
- Train the on-call team and draft initial runbooks
- Establish baseline performance metrics
Phase 2: Expand (6–8 weeks)
- Roll out instrumentation across all services
- Add distributed tracing and log correlation
- Deploy synthetic checks for key user journeys
- Refine alert thresholds using pilot data
Phase 3: Optimize (Ongoing)
- Reduce alert noise through threshold tuning
- Automate common remediation actions
- Improve dashboards from operator feedback
- Conduct quarterly monitoring strategy reviews
Automation and Runbooks
Converting alerts into repeatable, documented responses is what separates mature operations from ad-hoc firefighting. Create detailed runbooks for every P1 and P2 alert. Automate well-understood remediations like restarting failed services or scaling out a resource-constrained pool. Use ChatOps integrations (Slack, Microsoft Teams) so incident channels become the single source of truth during an event.
Security and Compliance in Monitoring
Monitoring data often contains sensitive information that requires the same protections as production data. Mask or redact personally identifiable information (PII) before it enters your log pipeline. Encrypt all monitoring data in transit and at rest. Implement role-based access controls so only authorized personnel can query sensitive dashboards. Define data retention policies that satisfy both operational needs and regulatory requirements such as GDPR, SOC 2, or HIPAA.
Measuring the ROI of Continuous Monitoring
The financial case for continuous monitoring is straightforward: prevented downtime and reduced engineering toil translate directly to savings. Use this formula to estimate your return:
Downtime savings = (Minutes of downtime prevented per year) x (Cost per minute of downtime)
Operational savings = (Engineering hours saved by automation per year) x (Hourly cost of engineer)
Total benefit = Downtime savings + Operational savings
ROI = (Total benefit - Monitoring cost) / Monitoring cost x 100%
Consider both direct costs (lost revenue, recovery expenses, SLA penalty payments) and indirect costs (reputation damage, customer churn, regulatory fines). For a mid-sized SaaS company with $5,000 per hour in downtime costs, reducing MTTR from 90 minutes to 15 minutes across 12 annual incidents saves over $75,000 per year, typically exceeding the cost of the monitoring platform itself.

Frequently Asked Questions
What is continuous server monitoring?
Continuous server monitoring is the practice of collecting, analyzing, and alerting on infrastructure metrics, logs, and traces around the clock. Unlike periodic health checks that sample system state at intervals, continuous monitoring streams data in near real time so teams can detect and respond to issues within seconds rather than minutes or hours.
Which server monitoring tools are best for small teams?
Small teams typically get the most value from Prometheus paired with Grafana for metrics and dashboards, combined with a managed logging service. This stack is free, well-documented, and scales to hundreds of servers. For teams that prefer a managed solution, New Relic offers a generous free tier that covers basic APM, infrastructure, and log monitoring.
How often should monitoring thresholds be reviewed?
Review alerting thresholds at least quarterly, and always after a significant incident or infrastructure change. Use post-mortem findings to adjust thresholds that either missed real issues or generated false positives. Teams that never revisit their thresholds accumulate alert debt that gradually erodes the value of the monitoring system.
What is the difference between monitoring and observability?
Monitoring tells you when something is wrong by checking predefined metrics against thresholds. Observability goes further by letting you ask arbitrary questions about system state using metrics, logs, and traces together. In practice, strong observability requires good monitoring as its foundation, plus distributed tracing and structured logging to explore unknown failure modes.
How does a managed service provider help with server monitoring?
A managed service provider like Opsio handles the operational burden of running monitoring infrastructure, configuring alerts, maintaining dashboards, and providing 24/7 on-call coverage. This frees internal engineering teams to focus on product development while ensuring monitoring expertise is always available. MSPs also bring cross-client experience that helps identify best practices and common failure patterns faster than most internal teams can on their own.
Next Steps
Building a reliable server monitoring practice is a progressive effort, not a one-time project. Start by defining SLOs tied to business outcomes, instrument your most critical services first, and expand coverage systematically. Invest in reducing alert noise early so your team trusts the system. Review and improve continuously through blameless post-mortems and quarterly strategy reviews.
- Audit your current monitoring coverage against the three-layer model (infrastructure, application, user experience)
- Define or refine SLOs for your top five revenue-critical services
- Evaluate whether your current tools meet your scalability and integration needs
- Write or update runbooks for your top 10 most common alerts
- Schedule a quarterly monitoring strategy review with your engineering and operations leadership
Need Help Building Your Monitoring Strategy?
Opsio’s managed infrastructure team can design, deploy, and operate a monitoring stack tailored to your environment. Get expert guidance without hiring a dedicated SRE team.
Talk to Our Team
Editorial standards: This article was written by a certified practitioner and peer-reviewed by our engineering team. We update content quarterly to ensure technical accuracy. Opsio maintains editorial independence — we recommend solutions based on technical merit, not commercial relationships.