In today’s digital landscape, server reliability directly impacts business success. Continuous server monitoring has evolved from a nice-to-have into a critical business enabler. For organizations relying on always-on services, implementing robust monitoring practices is essential for maintaining reliability, security, and customer trust. This comprehensive guide explores proven continuous server monitoring best practices, from establishing clear objectives to implementing effective tools and strategies that prevent costly downtime.
Why Continuous Server Monitoring Matters

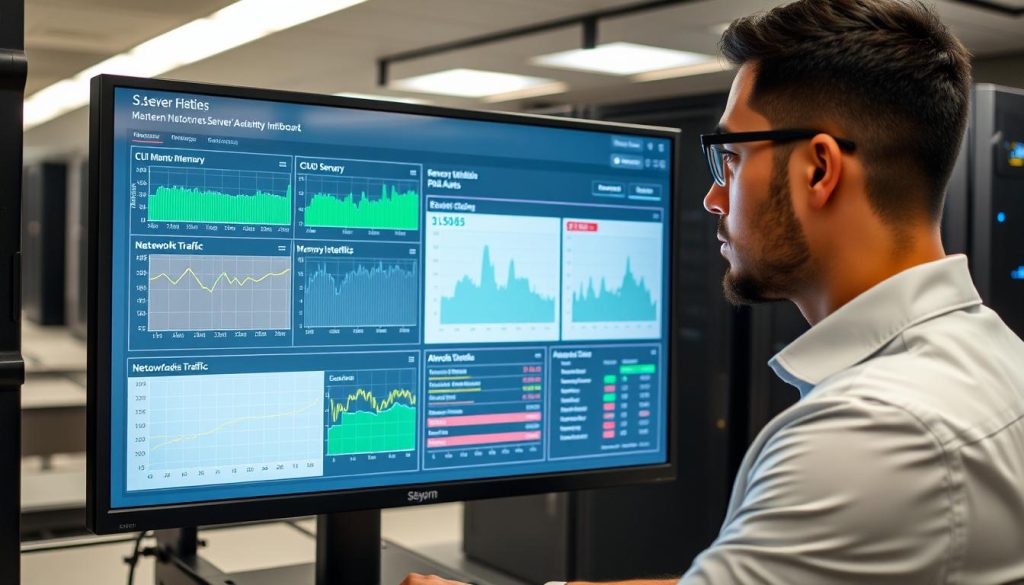
Continuous monitoring provides real-time visibility into critical server metrics
Continuous server monitoring provides real-time visibility into system health, enabling faster detection, diagnosis, and remediation of issues before they impact users. Unlike intermittent monitoring, which creates dangerous blind spots, continuous monitoring ensures you never miss critical performance anomalies or security threats.
Benefits of Continuous Monitoring
- Faster incident detection and reduced mean time to repair (MTTR)
- Improved capacity planning and resource optimization
- Enhanced security through early anomaly detection
- Better customer experience through proactive performance tuning
- Reduced operational costs by preventing expensive emergency interventions
Risks of Intermittent Monitoring
- Missed transient issues that occur between monitoring intervals
- Delayed detection leading to extended customer impact
- Inaccurate capacity planning causing overprovisioning or unexpected resource exhaustion
- Security vulnerabilities from undetected suspicious activities
According to industry research, organizations with mature monitoring practices experience significantly fewer unplanned outages and can reduce their operational costs by up to 30%. The investment in continuous monitoring typically pays for itself through prevented downtime alone.
Core Principles of Continuous Server Monitoring Best Practices
Establishing Monitoring Objectives and SLOs
Effective continuous server monitoring begins with clearly defined objectives aligned with business goals. Start by establishing Service Level Objectives (SLOs) that define what “good” looks like for your critical services.
For example, rather than simply monitoring CPU usage, define business-relevant objectives like “99.95% availability for the checkout API” or “95% of requests complete under 200ms.” These objectives provide clear targets that connect technical metrics to business impact.
“You can’t improve what you don’t measure, and you can’t measure what you haven’t defined. Clear SLOs are the foundation of effective monitoring.”
Google SRE Book
Choosing the Right Metrics: Performance, Availability, and Resource Usage
Select metrics that provide meaningful insights across three key dimensions:
Performance Metrics
- Request latency (p95, p99)
- Throughput (requests per second)
- Response times by endpoint
- Database query performance
Availability Metrics
- Successful response rate
- Uptime percentage
- Error rates (5xx, 4xx)
- Health check status
Resource Usage Metrics
- CPU utilization
- Memory consumption
- Disk I/O and space
- Network bandwidth
Beyond these basic metrics, track derivatives like error budgets, connection churn, and garbage collection pause times for Java applications. The most effective continuous server monitoring best practices involve selecting metrics that directly correlate with user experience.
Designing Alerting and Escalation Policies
Alert fatigue is a common challenge that undermines monitoring effectiveness. Design your alerting strategy to minimize noise while ensuring critical issues receive immediate attention:
- Alert only on actionable conditions that require human intervention
- Use multi-condition alerts to reduce false positives (e.g., high latency AND high error rate)
- Implement alert severity levels (P1, P2, P3) with appropriate escalation paths
- Include runbook links in alerts for immediate guidance
- Configure silence windows during planned maintenance
Example Alert Rule (Prometheus):
groups:
- name: example_alerts
  rules:
  - alert: HighErrorRate
    expr: sum(rate(http_requests_total{status=~"5.."}[5m])) / sum(rate(http_requests_total[5m])) > 0.05
    for: 2m
    labels:
      severity: page
    annotations:
      summary: "High 5xx error rate (>5%)"
      runbook: "https://wiki.example.com/runbooks/high-5xx"
Server Monitoring Strategies for Reliable Systems
Proactive vs. Reactive Monitoring: Strategy Comparisons
Effective continuous server monitoring best practices balance both proactive and reactive approaches:
| Aspect |
Proactive Monitoring |
Reactive Monitoring |
| Focus |
Leading indicators and trends |
Incident detection and response |
| Timing |
Before issues impact users |
After issues are detected |
| Metrics |
Capacity trends, saturation points |
Error rates, availability |
| Benefits |
Prevents incidents, reduces downtime |
Addresses issues quickly when they occur |
| Challenges |
Requires more analysis and planning |
Can lead to firefighting culture |
Best practice: Prioritize proactive monitoring while maintaining strong reactive capabilities. This hybrid approach delivers the best reliability outcomes while efficiently using engineering resources.
Layered Monitoring Approach: Infrastructure, Application, and User Experience
Implement a layered monitoring approach that covers your entire stack to avoid potential issues and increase performance levels:
Infrastructure Layer
- Host metrics (CPU, memory, disk)
- Network health and throughput
- Storage I/O and capacity
- Hardware status
Application Layer
- APM traces and transaction times
- Thread pools and queue depths
- Database query performance
- Service dependencies
User Experience Layer
- Synthetic checks
- Real User Monitoring (RUM)
- Frontend performance metrics
- User journey completion rates
Each layer provides different insights. Infrastructure alerts may be noisy if used alone; correlate with application-level metrics to find root causes faster. This multi-layered approach is a cornerstone of continuous server monitoring best practices.
Integrating Monitoring into DevOps and CI/CD Pipelines
Embed monitoring into your development workflows to create a continuous feedback loop:
- Run synthetic tests and health checks as part of CI/CD pipelines
- Add performance budgets to pull requests
- Implement canary releases with automated rollback triggers
- Track deployment-related metrics to identify problematic releases
Example CI/CD Integration (Jenkins Pipeline):
pipeline {
  stages {
    stage('Deploy') {
      steps {
        // Deployment steps
      }
    }
    stage('Monitor') {
      steps {
        // Run synthetic tests
        sh 'curl -s https://api.example.com/health | grep -q "status":"up"'

        // Check error rates post-deployment
        sh 'prometheus-query "increase(http_server_errors_total[10m]) > 5"'
      }
    }
  }
}
Monitoring Server Uptime Effectively
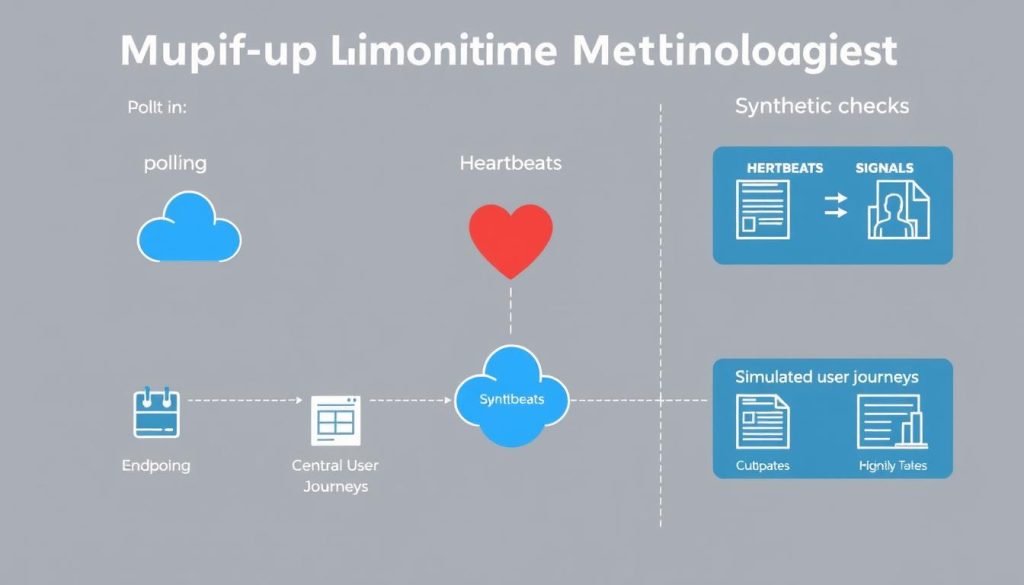
Uptime Monitoring Methodologies: Polling, Heartbeats, and Synthetic Checks
Implement multiple complementary approaches to monitor server uptime:
Polling
External probes that regularly check endpoints at fixed intervals.
- HTTP status checks
- TCP port checks
- DNS resolution checks
Heartbeats
Services actively send “I’m alive” signals to a monitoring service.
- Push-based health reporting
- Dead man’s switch patterns
- Scheduled job monitoring
Synthetic Checks
Scripted transactions that simulate real user interactions.
- User journey simulations
- API transaction checks
- Multi-step workflows
Best practice: Combine all three approaches for comprehensive coverage. Use synthetic checks for user experience, heartbeats for internal health reporting, and external polling for public availability verification.
Setting Realistic SLAs and Measuring Availability with Meaningful Metrics
Define realistic Service Level Agreements (SLAs) based on business requirements and technical capabilities:
| SLA Level |
Uptime Percentage |
Downtime Per Month |
Typical Use Case |
| Standard |
99.9% (three nines) |
43.2 minutes |
Internal business applications |
| High |
99.95% |
21.6 minutes |
E-commerce, SaaS applications |
| Premium |
99.99% (four nines) |
4.32 minutes |
Financial services, critical APIs |
| Mission Critical |
99.999% (five nines) |
26 seconds |
Emergency services, core infrastructure |
When setting SLAs, document your measurement methodology and include error budgets. Tie error budgets to release policies to prevent over-deployment when the system is approaching its error budget limit.
Incident Post-Mortems and Continuous Improvement to Minimize Downtime
After incidents occur, conduct blameless post-mortems to drive continuous improvement:
- Document the incident timeline, root cause, and resolution steps
- Calculate key metrics: detection time, MTTD (Mean Time to Detect), and MTTR (Mean Time to Resolve)
- Identify monitoring gaps that delayed detection or diagnosis
- Update runbooks and monitoring thresholds based on learnings
- Track recurring issues to identify systemic problems
“The goal of a post-mortem is not to assign blame, but to ensure the same issue doesn’t happen again or that we can detect and resolve it faster next time.”
This practice converts incidents into organizational knowledge and reduces recurrence rates, a key element of continuous server monitoring best practices.
Implementation Roadmap and Best Practices
Phased Rollout: Pilot, Expand, Optimize
Implement continuous server monitoring best practices through a phased approach:
Phase 1: Pilot (2-4 weeks)
- Instrument a subset of critical services
- Validate metrics, alerting, and dashboards
- Train on-call team and develop initial runbooks
- Establish baseline performance metrics
Phase 2: Expand (6-8 weeks)
- Roll out instrumentation across all services
- Implement distributed tracing and log correlation
- Add synthetic checks for key user journeys
- Refine alerting thresholds based on pilot learnings
Phase 3: Optimize (Ongoing)
- Tune thresholds and reduce alert noise
- Automate common remediation actions
- Improve dashboards based on user feedback
- Regularly review and update monitoring strategy
This phased approach minimizes disruption and ensures effective adoption of continuous server monitoring best practices across your organization.
Automation and Runbooks: Turning Alerts into Repeatable Responses
Automate repetitive tasks while ensuring safe guardrails for critical systems:
- Create detailed runbooks for common issues with step-by-step resolution procedures
- Implement automated remediation for well-understood problems (e.g., restarting failed services)
- Use ChatOps integrations to streamline incident response
- Document escalation paths and contact information for complex issues
Example Runbook Structure:
# High CPU Usage Runbook

## Symptoms
- CPU usage > 90% for > 5 minutes
- Increased latency in API responses
- Alerts from monitoring system

## Quick Checks
1. Check for recent deployments or changes
2. Identify top CPU-consuming processes: `top -c`
3. Check for unusual traffic patterns

## Resolution Steps
1. If caused by specific process:
   - Analyze if process is behaving normally
   - Restart if necessary: `systemctl restart service-name`

2. If caused by traffic spike:
   - Verify autoscaling is working
   - Manually scale if needed: `kubectl scale deployment/api --replicas=5`

3. If persistent issue:
   - Engage development team
   - Consider performance optimization

## Escalation
- If unresolved after 15 minutes, escalate to:
  - Primary: DevOps Team Lead (555-123-4567)
  - Secondary: Backend Engineering Manager (555-234-5678)
Security and Compliance Considerations in Monitoring Data Collection
Ensure your monitoring practices adhere to security and compliance requirements:
- Data Protection: Mask or redact personally identifiable information (PII) before storing logs
- Encryption: Encrypt monitoring data both in transit and at rest
- Access Controls: Implement role-based access controls (RBAC) for monitoring dashboards and data
- Retention Policies: Define data retention periods that comply with regulatory requirements
- Audit Trails: Maintain logs of who accessed monitoring data for compliance purposes
Consider data residency requirements when selecting between managed and self-hosted monitoring solutions, especially for organizations operating in regions with strict data sovereignty laws.
Case Studies and ROI of Continuous Monitoring
Example 1: Reducing MTTR with Real-Time Monitoring Solutions
A mid-sized SaaS company implemented Prometheus and Grafana with comprehensive alerting and runbooks. The results were significant:
- Before: Average MTTR of 90 minutes for critical incidents
- After: Average MTTR reduced to 12 minutes
- Improvement Factors:
- Real-time alerts with actionable context
- Distributed tracing for faster root cause analysis
- Automated remediation for common failure modes
ROI Calculation:
Estimated revenue impact of downtime: $1,200/hour
MTTR reduction: 90 minutes - 12 minutes = 78 minutes (1.3 hours)
Savings per incident: 1.3 hours × $1,200/hour = $1,560
Annual incidents: 12
Annual savings: $1,560 × 12 = $18,720
This calculation doesn’t include additional benefits like improved customer satisfaction and retention, which further increased the ROI of their continuous monitoring investment.
Example 2: Improving Capacity Planning Using Server Performance Monitoring Techniques
An online retailer implemented continuous performance monitoring and trend analysis before their peak holiday season:
- Discovered that API database latency increased by 40% when connections exceeded 8,000 concurrent sessions
- Implemented connection pooling and scaled database read replicas based on trend-based forecasting
- Successfully handled a 35% year-over-year traffic increase during Black Friday without performance degradation
ROI Calculation:
Estimated lost sales during 1-hour outage: $150,000
Probability of outage without improvements: 70%
Expected cost of outage: $150,000 × 0.7 = $105,000
Cost of monitoring implementation: $35,000
Net benefit: $105,000 - $35,000 = $70,000
ROI: ($70,000 ÷ $35,000) × 100% = 200%
By investing in proactive monitoring and capacity planning, the retailer not only avoided a potential outage but also gained valuable insights for future scaling decisions.
Calculating the Benefits of Continuous Monitoring for Operations and Business Continuity
To estimate the ROI of continuous monitoring for your organization, use this simplified formula:
Cost saved = (Downtime minutes prevented per year) × (Cost per minute of downtime)
Operational savings = (Hours saved by automation per year) × (Average hourly cost of engineer)
Total benefit = Cost saved + Operational savings
ROI = (Total benefit - Cost of monitoring) ÷ Cost of monitoring × 100%
Consider both direct costs (lost revenue, recovery expenses) and indirect costs (reputation damage, customer churn) when calculating the cost of downtime. This calculation helps justify investments in continuous server monitoring best practices and tools.
Conclusion
Implementing continuous server monitoring best practices is essential for maintaining reliable, high-performing systems in today’s digital landscape. By defining business-aligned SLOs, selecting meaningful metrics, designing effective alerting strategies, and choosing the right tools, organizations can significantly reduce downtime, improve performance, and enhance customer experience.
The most successful monitoring implementations take a phased approach, starting with critical services and expanding methodically. They balance proactive and reactive monitoring, implement a layered approach covering infrastructure through user experience, and continuously improve based on incident learnings.
As demonstrated by the case studies, the ROI of continuous monitoring can be substantial, with benefits extending beyond direct cost savings to include improved customer satisfaction and competitive advantage.
Actionable Next Steps
- Assess your current monitoring capabilities against the best practices outlined in this guide
- Define clear SLOs for your critical services based on business impact
- Evaluate monitoring tools that align with your technical requirements and budget
- Implement a pilot monitoring project for your most critical service
- Develop runbooks for common issues to standardize response procedures


